

Performance analytics gives an organization a disciplined way to understand what’s working, what isn’t, and why. It helps connect activity to outcomes, strategy to execution, and investment to measurable return. Instead of relying on instinct, isolated KPIs, or whichever chart happens to be on the screen, decision-makers get a structured view of how people, processes, products, and systems are actually performing. That’s what makes performance analytics such an integral component of business today.
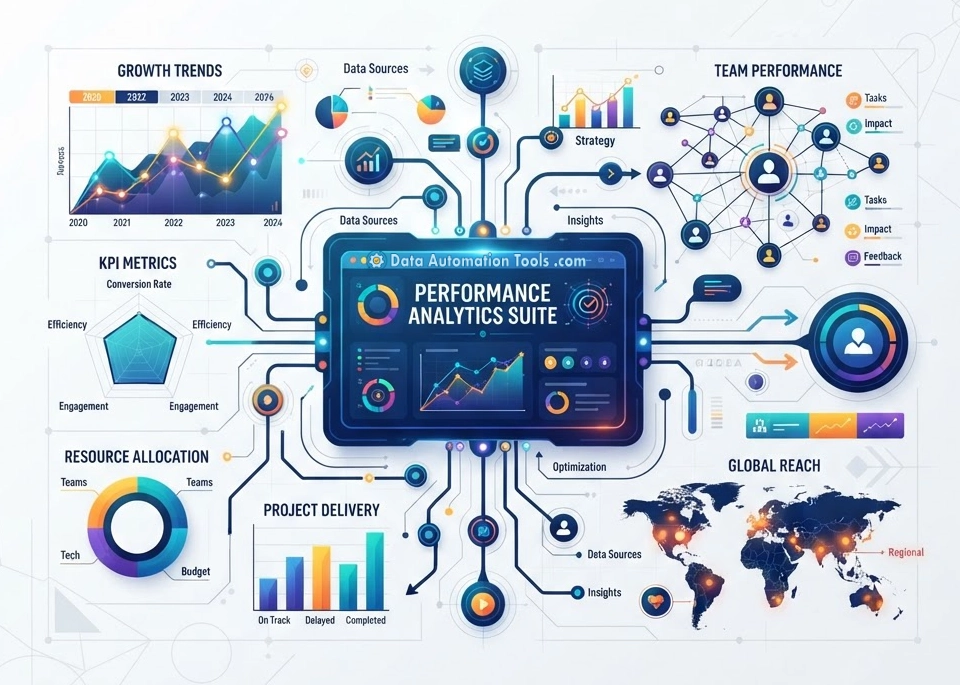
Most organizations don’t suffer from a lack of data. They suffer from a lack of clarity. There are data analysis tools and dashboards everywhere, reports landing in inboxes, metrics appearing in meetings, and spreadsheets multiplying quietly in the background. Sales has its numbers. Marketing has another set. Finance has the official version. Operations has the numbers it actually uses to run the business. Depending on which room you’re in, you can hear several different explanations of how the company is performing, all supported by data.
This matters because performance problems are often hidden inside apparently acceptable results. Revenue may be growing while margins are shrinking. Customer acquisition may look strong while retention is quietly deteriorating. A service team may be closing more tickets while customer satisfaction declines. A factory may hit its output target by running equipment in ways that increase maintenance costs and energy consumption. A sales team may appear productive because it’s booking meetings, even though few of those meetings are turning into revenue.
Without performance analytics, organizations often celebrate activity and discover the consequences later. Good performance analytics brings those relationships into view. It doesn’t just tell you that a number moved. It helps you understand whether the movement is important, what caused it, how it compares with expectations, and what you can reasonably do about it.
For data professionals, that’s where the real work begins. The technical objective isn’t simply to collect more information or produce a more polished dashboard. It’s to create a reliable analytical system that helps the business make better decisions.
And that distinction is crucial. A company can have excellent reporting and poor decision-making. It can have an expensive cloud data platform, a modern semantic layer, and dozens of dashboards, yet still struggle to answer basic questions about performance. Technology creates the possibility of insight. It doesn’t guarantee it.
Performance analytics closes that gap by tying data to operational and strategic questions that people genuinely need to answer.
What Performance Analytics Is and Isn’t
Performance analytics is the process of collecting, organizing, analyzing, and interpreting data to understand how well an organization, team, process, asset, product, campaign, or individual is performing. At the most basic level, it compares actual results with expected results.
Did revenue meet the forecast? Did the campaign generate the intended return? Did the production line hit its output target? Did the new onboarding process reduce customer churn? Did the investment in automation lower processing time? Did the sales team move enough qualified opportunities through the pipeline? Those questions sound straightforward, but the analysis usually isn’t.
Performance rarely depends on a single number. It emerges from a network of conditions, decisions, actions, and constraints. Revenue, for instance, may be influenced by pricing, product availability, sales capacity, lead quality, market demand, customer retention, and competitive behavior. A single metric can show the result, but it won’t necessarily explain it. That’s why performance analytics is broader than traditional reporting.
BI shows performance. Data analytics explains and predicts it. Performance analytics connects both to action.
For example, a Power BI dashboard showing sales against quota is BI. An analysis identifying why win rates fell is data analytics. A system that monitors quota attainment, diagnoses the decline, forecasts the quarter, and recommends which opportunities to prioritize is performance analytics.
So, in most organizations, performance analytics will be delivered through the BI function or BI platform. But a mature performance analytics program draws heavily on data analytics, especially once it incorporates forecasting, experimentation, anomaly detection, segmentation, or optimization.
The boundary also depends on organizational language. Some companies use “performance analytics” as a polished name for KPI reporting. Others use it to describe a much richer decision-support discipline. The term itself is less important than whether the system merely reports results or actually helps people understand and improve them.
Reporting tells you what happened. Performance analytics aims to tell you what happened, why it happened, what’s likely to happen next, and what action might improve the outcome. It often draws on several forms of analytics. Descriptive analytics summarizes past and current performance. Diagnostic analytics explores the causes behind it. Predictive analytics estimates what may happen next. Prescriptive analytics evaluates possible actions and recommends responses.
In practice, these categories overlap. A sales dashboard may show that win rates have fallen, allow users to drill into the affected segments, forecast the impact on quarterly revenue, and identify which opportunities deserve immediate attention. That’s descriptive, diagnostic, predictive, and prescriptive analysis working together.
Performance analytics also depends on context. A 5 percent increase in revenue may be excellent in a declining market and disappointing in a rapidly growing one. A longer customer service call may indicate inefficiency, or it may mean that an agent solved a difficult problem properly instead of rushing the customer off the phone.
Metrics don’t interpret themselves. The job of performance analytics is to place numbers within the right business context so that people can distinguish between noise, normal variation, genuine progress, and emerging risk.
Performance Analytics Isn’t Just a Dashboard
One of the easiest mistakes to make is equating performance analytics with dashboards. Dashboards are useful. They can organize information, highlight trends, and make results accessible to a broad audience. But a dashboard is only the delivery layer. It isn’t the analytical discipline itself. A dashboard may display conversion rates, customer acquisition costs, pipeline value, and monthly recurring revenue. Whether those numbers are meaningful depends on everything underneath them.
Are the definitions consistent? Is revenue recognized the same way across systems? Are marketing and sales using the same definition of a qualified lead? Is customer churn calculated by account, contract, or user? Is the data current? Are historical values restated when business rules change? Can users trace a KPI back to its source?
If the answers are unclear, a polished dashboard may simply present unreliable information more convincingly. Performance analytics begins before visualization. It starts with business questions, metric definitions, data models, ownership, validation, and context. It requires a common understanding of what performance means and how it should be measured. The visual layer matters, but it comes later.
A well-designed performance analytics system may include dashboards, alerts, scorecards, forecasts, anomaly detection, workflow integrations, and natural-language interfaces. What ties these pieces together is not the technology. It’s the purpose: helping people understand performance and act on that understanding.
Is Performance Analytics Worth the Investment?
This is where the conversation gets more interesting. The case for performance analytics can sound obvious. Better data should lead to better decisions, which should lead to better results. But organizations have spent enormous amounts of money on analytics programs that failed to produce meaningful business value.
So the skepticism is justified. Performance analytics can require substantial investment in data platforms, integration, governance, modeling, visualization, training, and ongoing support. There may be licensing costs, cloud infrastructure costs, consulting fees, data engineering work, and the opportunity cost of pulling subject-matter experts into lengthy requirements meetings.
The benefits, meanwhile, can be difficult to isolate. If revenue improves after a new analytics system is introduced, how much of that improvement came from the analytics? How much came from market conditions, better leadership, a strong product launch, or a change in pricing?
It isn’t always easy to draw a clean line between insight and financial return. Critics also point out that organizations frequently build analytics capabilities they don’t fully use. Dashboards are launched with enthusiasm, viewed heavily for a few weeks, and then quietly ignored. Teams continue making decisions in spreadsheets. Executives ask for manually prepared summaries because the official system doesn’t answer the questions they care about.
In those cases, performance analytics can become an expensive reporting project with little influence on actual performance. But that doesn’t mean the investment is inherently weak. It means the value depends on how the program is designed. Performance analytics is usually worth the investment when it addresses decisions that are frequent, consequential, and improvable.
A retailer that can reduce stockouts and excess inventory by improving demand forecasts may generate a clear return. A manufacturer that predicts equipment failure can reduce downtime and maintenance costs. A subscription business that identifies customers at risk of leaving can protect recurring revenue. A logistics company that optimizes routes can reduce fuel use and improve delivery performance.
The more often a decision occurs, the more value even a modest improvement can create. The business case becomes weaker when analytics is built without a defined decision, user, or operational outcome. A vague objective such as “becoming more data-driven” may support almost any project, which means it supports none of them particularly well.
A stronger case begins with a specific question. Which customers should receive retention outreach? Which leads should sales prioritize? Which assets are likely to fail? Which marketing channels are producing profitable customers? Which processes create avoidable delays? Which product features are associated with long-term adoption?
Once the decision is clear, the expected value becomes easier to estimate. Performance analytics should also be judged against the cost of continuing without it. Poor decisions already have a price. So do delays, waste, missed opportunities, duplicate work, unreliable forecasts, and internal arguments over whose numbers are correct.
The real comparison isn’t between analytics and no cost. It’s between the cost of building analytical capability and the cost of operating with limited visibility.
Performance Analytics Platforms Of Note
Performance analytics doesn’t occupy one tidy software category. Some platforms are built specifically to monitor operational performance inside a particular business system, while others are broad BI and data analytics tools that can be configured around almost any set of KPIs. The most prominent choices include ServiceNow, Microsoft Power BI, Tableau, Looker, Qlik, and ServiceNow.
That workflow context is what distinguishes ServiceNow from Power BI, Tableau, Looker, and Qlik. Those are general-purpose BI and data analytics platforms. They can analyze performance across sales, finance, marketing, operations, products, customers, and supply chains, usually by bringing together data from several source systems. ServiceNow is more opinionated: it’s particularly valuable when the processes, records, assignments, and service outcomes being measured already live on the Now Platform.
Microsoft Power BI is often the practical enterprise choice, particularly for organizations already invested in Microsoft 365, Azure, or Fabric. It supports interactive reports, dashboards, governed semantic models, embedded analytics, and connections to a wide range of cloud and on-premises systems. For performance analytics, it can bring financial, commercial, and operational measures into a common reporting layer. Its accessibility is both its strength and its recurring governance problem. It’s easy for departments to create their own reports; it’s considerably harder to prevent them from creating incompatible definitions of revenue, churn, or customer value.
Tableau remains a strong choice when visual exploration is central to the analytical work. It gives analysts considerable freedom to investigate data, compare related views, and build interactive dashboards that communicate more than a conventional scorecard. That flexibility makes Tableau useful for diagnosing performance rather than merely displaying it. The trade-off is that freedom demands discipline. A thoughtfully designed workbook can expose a pattern immediately; a sprawling collection of filters, worksheets, and calculations can become difficult to use and even harder to maintain.
Looker is particularly attractive to organizations that want business logic governed centrally. Its LookML modeling layer allows data teams to define dimensions, calculations, relationships, and important metrics before exposing them to users. That makes it harder for every department to invent its own version of a KPI. Looker is a natural fit for cloud data warehouse environments where the organization wants reusable metrics, self-service exploration, embedded analytics, and a controlled source of truth. It generally asks for more modeling discipline upfront, but that investment can prevent a great deal of metric chaos later.
Qlik, particularly Qlik Cloud Analytics and Qlik Sense, approaches exploration through its associative analytics engine. Users can move through relationships in the data without being confined to a rigid sequence of predefined drill-downs. That can be useful when performance problems cross conventional departmental boundaries and the analyst doesn’t yet know which relationship will prove important. Qlik also supports dashboards, reporting, embedded analytics, governed datasets, and AI-assisted analysis. Its approach can take some adjustment for teams accustomed to conventional SQL reporting, but it’s powerful when open-ended exploration matters.
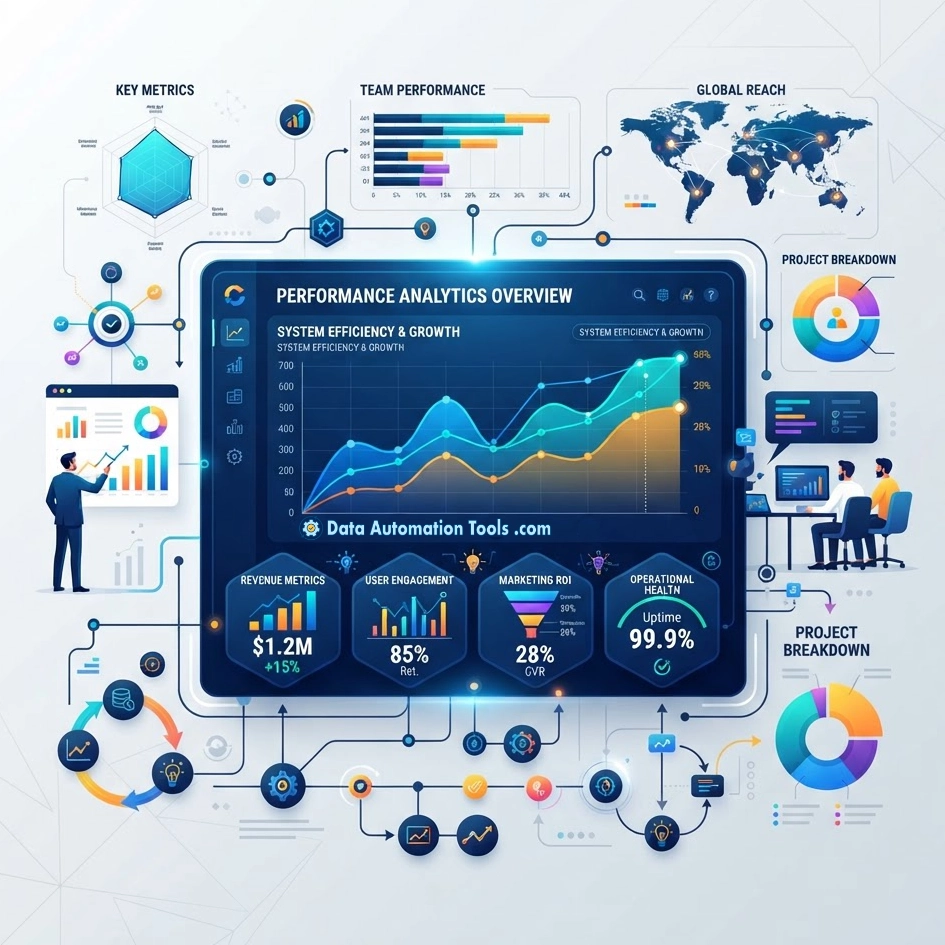
ServiceNow‘s performance analytics is especially strong in IT service management, customer service, HR service delivery, security operations, and other workflows already managed on the Now Platform. In ServiceNow’s current architecture, Platform Analytics provides the unified dashboard and visualization experience, while Performance Analytics indicators supply time-series KPI data for analyzing trends and process improvement. That naming can be slightly confusing, but the practical idea is straightforward: ServiceNow measures the performance of work taking place inside ServiceNow and puts the analysis close to the people who can act on it.
The right choice depends less on which vendor has the longest feature list than on where the performance data lives and how people need to use it. ServiceNow is the natural candidate for measuring and improving ServiceNow-based workflows. Power BI, Tableau, Looker, and Qlik are better suited to analysis that cuts across multiple operational systems and departments. Many large organizations use both: ServiceNow for workflow-native performance management and a broader BI platform for enterprise-wide analysis.
Whichever platform you choose, the software won’t rescue poorly defined KPIs, inconsistent source data, or a reporting program that isn’t connected to real decisions. The tool can organize, calculate, and display performance. The organization still has to agree on what good performance actually means.
Common Industry Applications of Performance Analytics
Performance analytics isn’t confined to one department or industry. The underlying discipline remains the same—measure outcomes, understand what drives them, and use the findings to improve future results—but the questions change depending on the work being analyzed.
A sales leader wants to know why deals are stalling. A manufacturer wants to reduce downtime. A marketing team wants to separate useful demand generation from expensive noise. A product manager wants to understand whether customers are receiving value, not merely clicking buttons. A hospital may need to balance patient demand, staffing, cost, and quality of care.
That range is one reason performance analytics can be difficult to define neatly. It’s less a single application than a way of thinking about performance across functions, processes, and assets.
Sales Performance Analytics
Sales is one of the most obvious applications because CRM systems already capture a large amount of measurable activity. Leads, calls, emails, meetings, opportunities, stage changes, forecasts, contract values, and closed deals all leave a data trail. The problem is that sales organizations often confuse activity with performance.
A representative who makes 100 calls isn’t necessarily outperforming someone who makes 40. The second representative may be targeting stronger accounts, reaching more decision-makers, creating better-qualified opportunities, and closing more profitable customers. Performance analytics helps separate movement from progress. It can show where opportunities are getting stuck, which lead sources produce the highest win rates, how long deals spend in each stage, and which products or customer segments are easiest—or hardest—to sell.
It also makes forecasting less dependent on optimism. Instead of relying entirely on a representative’s confidence in a deal, the organization can incorporate opportunity age, stage history, engagement, account characteristics, and past conversion patterns. The more mature approach goes beyond measuring whether a contract was signed. It connects sales data with product usage, payment behavior, service demand, retention, and profitability. A deal that closes quickly but churns three months later may look good in the CRM and terrible in the financial results.
Marketing Performance Analytics
Marketing has no shortage of data. Impressions, clicks, visits, downloads, leads, conversion rates, engagement, and advertising costs can all be tracked in near real time. Unfortunately, many of those metrics are easy to inflate and difficult to connect with actual value. A campaign can generate thousands of clicks and almost no useful demand. A low-cost lead channel may produce people who never buy. A piece of content may attract a large audience that has little relationship to the company’s target market.
Performance analytics connects marketing activity with commercial outcomes. That usually means integrating advertising, web analytics, CRM, sales, customer, and financial data rather than evaluating each channel inside its own reporting system. Attribution remains one of the hardest parts. A customer may see an advertisement, read an article, attend a webinar, receive several emails, speak with sales, and eventually return through a branded search. Deciding which interaction deserves credit isn’t a simple factual exercise. It’s a modeling choice.
First-touch attribution favors discovery. Last-touch attribution favors the final interaction. Multi-touch models distribute credit according to assumptions that may or may not reflect reality. That doesn’t make attribution useless. It means the model should be treated as a lens rather than a verdict.
The best marketing performance analysis also follows customers beyond the initial conversion. Acquisition cost matters, but so do retention, expansion, lifetime value, and profitability. A channel that appears expensive may produce highly loyal customers. A cheaper one may deliver volume followed by rapid churn.
Financial Performance Analytics
Finance has always analyzed performance, but modern performance analytics gives financial teams a faster and more detailed view of what’s producing the numbers. Traditional financial statements remain essential. They show revenue, expenses, profit, assets, liabilities, and cash flow. What they don’t always show clearly is which operational decisions caused those outcomes.
Performance analytics connects the financial results with their underlying drivers. If costs rise, the business can examine the increase by supplier, facility, product, project, or process. If revenue grows, analysts can determine whether the improvement came from higher volume, increased prices, favorable product mix, new customers, or better retention.
That context matters because apparently positive results can conceal trouble. Revenue growth driven by extreme discounting may weaken margin. Improved short-term profit may reflect delayed hiring, maintenance, or product investment. Reported earnings can rise while cash flow deteriorates. Performance analytics also supports rolling forecasts and scenario planning. Rather than treating the annual budget as fixed truth, organizations can update assumptions as demand, pricing, hiring, and costs change.
Finance then becomes more than the department that reports the score after the period closes. It helps explain what’s driving performance while there’s still time to influence it.
Operational Performance Analytics
Operations is often where analytics delivers the clearest and most measurable return. Manufacturers, logistics companies, hospitals, utilities, retailers, and service organizations all depend on processes that can be evaluated through speed, cost, capacity, reliability, quality, and resource use.
Performance analytics can expose bottlenecks, delays, defects, downtime, process variation, inventory imbalances, and underused capacity. It can show where work slows down, where errors enter a process, and where resources are being consumed without producing enough value.
Variation is often where the interesting questions begin. Two facilities may use the same equipment and follow the same procedures but produce different results. One shift may complete more work with fewer defects. One distribution center may process orders faster despite similar staffing.
Those differences shouldn’t automatically be attributed to employee effort. The cause may be equipment condition, training, layout, demand patterns, scheduling, or a local workaround that happens to be more effective than the official process. Operational analytics gives teams a way to investigate those differences rather than guess at them.
In fast-moving environments, real-time analysis can also support intervention. A production system may detect abnormal equipment behavior. A logistics platform may identify routes falling behind schedule. A hospital may see that patient demand is about to exceed available capacity. Knowing what happened is useful. Knowing early enough to respond is much more valuable.
Customer Service and Experience Analytics
Customer service teams are often managed through metrics that are convenient rather than genuinely informative. Average handling time, calls per hour, and tickets closed are easy to calculate. If they’re emphasized too heavily, they can encourage representatives to rush customers, avoid complex cases, or close issues before they’re truly resolved.
A better performance framework balances efficiency with quality. First-contact resolution, repeat contacts, escalation rates, response time, satisfaction, sentiment, and case complexity can provide a more complete view. Even then, the numbers need context. A long call may reflect poor performance, or it may reflect an employee taking the time to solve a complicated problem properly.
Customer service data becomes especially useful when it’s connected with information from other functions. A recurring complaint may reveal a product defect. A sudden rise in billing calls may point to a finance or systems problem. A high volume of onboarding questions may indicate that the product experience is confusing. In that sense, service analytics isn’t just about evaluating agents. It’s a listening system for the whole organization.
Product Performance Analytics
Product teams use performance analytics to understand whether people adopt, use, and continue to value a product. For digital products, common measures include activation, engagement, feature adoption, conversion, retention, and expansion. For physical products, the analysis may include sales, returns, defects, warranty claims, customer feedback, and margin. The difficult part is deciding which behavior represents genuine value.
Daily active users may be essential for a social platform and nearly meaningless for software used once a month to complete an important financial task. Heavy feature usage may signal engagement, or it may mean that the feature requires too many steps. Product analytics therefore needs to begin with the customer’s intended outcome. The real question isn’t simply whether someone clicked a feature. It’s whether the feature helped that person accomplish something useful.
That often requires combining behavioral data with interviews, surveys, support records, and commercial outcomes. Controlled experimentation can also help product teams evaluate changes, but experiments need careful interpretation. A statistically significant result may be too small to matter commercially. A short-term increase in engagement may harm long-term satisfaction. A change that benefits new users may frustrate existing customers.
The numbers can show what changed. Product judgment is still required to decide whether the change was worthwhile.
Workforce and People Analytics
Workforce analytics can help organizations understand hiring, retention, engagement, skills, workload, and leadership effectiveness. It can also go wrong faster than almost any other performance application. The problem begins when organizations use easily measured activity as a substitute for meaningful contribution.
Counting emails, meetings, keystrokes, or time spent online rarely provides a fair view of knowledge work. Employees create value through judgment, collaboration, creativity, mentoring, and problem-solving—activities that aren’t always captured in a system log.
A more useful approach combines quantitative and qualitative evidence. Project outcomes, work quality, customer feedback, collaboration, skill development, and progress toward agreed goals may all have a place. Comparison also needs context. A salesperson building a new territory faces different conditions from one managing an established account base. A support specialist handling escalations shouldn’t be evaluated by the same speed target as someone dealing with routine requests.
Workforce analytics is most constructive when it identifies obstacles, training needs, workload imbalances, and retention risks. It becomes destructive when it turns into surveillance or gives weak metrics more authority than informed managerial judgment.
Supply Chain and Logistics Analytics
Supply chain performance is difficult because every decision affects several other parts of the system. Lower inventory can reduce carrying costs but increase the risk of stockouts. Faster shipping may improve customer service while raising transportation costs. Concentrating purchasing with one supplier may produce better pricing but create dependency.
Performance analytics helps make these trade-offs visible. Organizations can monitor supplier reliability, lead times, inventory turnover, order accuracy, transportation cost, delivery performance, and disruption risk. Forecasting models can estimate demand, while optimization systems can recommend inventory levels, routes, or sourcing choices.
The value comes from viewing the network as a connected system rather than treating each metric separately. A warehouse may improve its own efficiency by delaying certain orders, for example, while making delivery performance worse for the company as a whole. A purchasing team may reduce unit cost by ordering in larger quantities while increasing inventory and storage costs elsewhere.
Performance analytics helps reveal when one function’s apparent success is simply moving the problem to another part of the chain.
Asset and Energy Performance Analytics
Organizations in manufacturing, utilities, transportation, property management, and infrastructure depend on physical assets that must operate reliably and efficiently.
Asset performance analytics uses maintenance histories, sensor readings, operating conditions, runtime data, and energy consumption to understand how individual machines and systems behave.
This can support predictive maintenance, reduce downtime, extend equipment life, and improve energy efficiency.
A motor drawing more current than usual may be developing a mechanical problem. A pump may be running longer to produce the same output. A building’s cooling system may be operating heavily during periods of low occupancy.
The asset-level detail matters because aggregated information often conceals the source of the problem. A facility-wide energy bill can show that consumption increased. It can’t necessarily identify which compressor, air handler, production line, or lighting system caused the increase.
The investment can be significant, particularly when older assets need sensors, networking, or integration work. The business case depends on the cost of downtime, maintenance, energy, and replacement. For expensive or critical equipment, even a small improvement in reliability may justify the investment.
Healthcare Performance Analytics
Healthcare organizations have to balance clinical quality, patient access, staffing, cost, compliance, and operational capacity. Improving one measure can easily put pressure on another.
Performance analytics can help hospitals and health systems monitor wait times, readmissions, treatment outcomes, bed utilization, staffing levels, appointment availability, and patient satisfaction.
But healthcare data is unusually sensitive and context-heavy. A hospital treating more complex cases may appear to have worse outcomes unless the analysis adjusts for patient risk. Shorter stays may indicate greater efficiency, or they may increase the likelihood of readmission.
That makes metric design especially important. Measures need to account for case complexity, population differences, and clinical context rather than rewarding speed or volume indiscriminately.
Used properly, performance analytics can help identify capacity constraints, variation in care, and opportunities to improve both outcomes and resource use. Used badly, it can reduce complex clinical decisions to targets that don’t reflect the realities of patient care.
Retail and E-Commerce Analytics
Retailers operate at the intersection of demand, pricing, inventory, merchandising, customer behavior, and logistics. Performance analytics can track sales by product, location, channel, and customer segment. It can examine conversion, basket size, return rates, inventory turnover, markdowns, and promotion effectiveness.
The real value lies in connecting those measures. A product may sell well but generate poor margin because it requires heavy discounting. A store may report strong revenue while tying up too much capital in slow-moving inventory. An e-commerce campaign may create a surge in orders that the fulfillment network can’t handle efficiently.
Retail analytics can also help organizations understand how online and physical channels interact. A customer may research online, purchase in a store, and later return through the website. Treating each channel independently produces an incomplete view. Performance analysis gives retailers a better chance of optimizing the customer relationship and the economics behind it rather than simply maximizing transactions.
Sports and Human Performance Analytics
Sports is one of the most visible applications of performance analytics because the results are public, competitive, and endlessly measured. Teams analyze movement, positioning, workload, tactics, decision-making, shot quality, opponent behavior, and recovery. Wearable devices record speed, acceleration, distance, and physiological signals. Video systems create detailed spatial and event data.
Analytics can help coaches design tactics, manage athlete workload, evaluate recruitment targets, and identify players whose value isn’t obvious in traditional statistics. It also demonstrates the limits of measurement.
Confidence, leadership, teamwork, pressure, and judgment can influence performance without fitting neatly into a dataset. A model may estimate the probability of a successful play, but it can’t fully account for every human and competitive factor involved. The strongest sports organizations use analytics to challenge and improve judgment, not replace it. That’s a useful principle for performance analytics in every other field as well.
Weaknesses and Trade-Offs
Performance analytics has real limitations. The first is that measurement can change behavior. Once a metric becomes a target, people may optimize the number rather than the underlying result.
A support team measured heavily on speed may rush customers. A sales team rewarded for new contracts may sign poor-fit customers. A factory judged only on output may sacrifice quality or equipment health. This is often described through Goodhart’s law: when a measure becomes a target, it can stop being a good measure.
Another weakness is false precision. Analytics systems may present results to several decimal places even when the underlying data is incomplete or the business definitions are debatable. A number can look exact while still being highly uncertain.
Correlation is another concern. Performance analytics frequently identifies relationships, but relationships don’t necessarily establish cause. Customers who use a certain feature may be more likely to stay, but that doesn’t prove the feature caused retention. More engaged customers may simply be more likely to use everything.
Historical bias can also shape results. Models trained on past decisions may reproduce past errors or inequities. This is especially important in hiring, lending, healthcare, and employee evaluation.
There’s also a trade-off between standardization and local relevance. A company needs shared definitions, but individual departments may face circumstances that require different measures. Too much standardization can make analytics less useful. Too little creates inconsistency and confusion.
Finally, there’s the cost of attention. More metrics can reduce clarity rather than improve it. Every dashboard, alert, and KPI competes for limited cognitive capacity. The objective isn’t maximum measurement. It’s better judgment.
Challenges to Implementation
The technology is rarely the only challenge, and it’s often not the hardest one. The first problem is unclear ownership. Who defines revenue? Who owns the customer metric? Who decides how churn is calculated? If responsibility is vague, definitions drift.
Data quality is another major obstacle. Missing values, duplicate records, inconsistent identifiers, and manual entry errors can undermine trust. Fixing those problems takes ongoing operational discipline, not a one-time cleanup.
Integration can be equally difficult. The data needed to understand performance may be spread across finance, CRM, marketing, operations, and support platforms. Connecting those systems requires engineering work and agreement on how entities and events relate.
User adoption is another challenge. People won’t use an analytics product merely because it exists. It must answer questions they care about, fit into their workflow, and be easier than the spreadsheet or informal method it’s replacing. Change management matters because analytics can alter authority. Shared data may challenge established narratives or expose performance problems. Some people will welcome that. Others may resist it.
Skills are also uneven. Executives, managers, analysts, and operational users need different levels of data literacy. An organization can’t assume that everyone will interpret forecasts, confidence intervals, or statistical variation correctly. Successful implementation therefore requires technical architecture, governance, communication, training, and executive support.
What a Strong Performance Analytics Program Looks Like
A strong program starts with decisions, not data. It identifies the decisions the organization wants to improve, the users responsible for those decisions, and the outcomes that matter. It then works backward to determine which information is needed.
Metric definitions are documented and governed. Data sources are understood. Quality is monitored. Users can trace important figures back to their origin. The analytical products are designed for specific audiences. Executives receive strategic views. Managers receive operational detail. Analysts have access to flexible exploration. Frontline users receive timely recommendations or alerts inside the tools where they already work.
Strong programs also evaluate whether the analytics itself is producing value. Are users acting on the insights? Are decisions becoming faster or more accurate? Are forecasts improving? Are operational results changing? Are manual reporting costs falling?
Performance analytics should be held to the same standard as any other investment.
The Importance of Data Culture
Technology can deliver numbers, but culture determines what happens next.In a healthy data culture, people are curious rather than defensive. They’re willing to investigate disappointing results without immediately looking for someone to blame. They understand that metrics are evidence, not personal jud gments.
Leaders play an important role. If executives ignore data when it conflicts with their preferences, employees will quickly learn that analytics is ceremonial. If leaders punish every unfavorable number, teams will hide problems or manipulate metrics.
Psychological safety matters because organizations need bad news early. A performance analytics system should help surface risks before they become crises. Data culture also requires humility. Models can be wrong. Metrics can be incomplete. People closest to the work may understand context that the dashboard doesn’t show.
Good analytics supports informed conversation. It doesn’t eliminate the need for one.
The Future of Performance Analytics
Performance analytics is becoming faster, more automated, and more deeply embedded in operational systems. Generative AI is making analytics easier to access through natural-language questions, automated summaries, and conversational interfaces. Machine learning can identify anomalies, forecast outcomes, and recommend actions across large and complex datasets.
Analytics is also moving closer to the moment of decision. Instead of waiting for users to open a dashboard, systems can deliver insights inside CRM platforms, financial workflows, maintenance systems, and customer service tools.
Digital twins may allow organizations to simulate changes in factories, buildings, logistics networks, and infrastructure before making them in the physical world. But the future won’t be defined only by more advanced technology. Governance, transparency, and trust will become even more important as automated recommendations influence consequential decisions.
The winning organizations won’t necessarily be those with the largest datasets or the most complex models. They’ll be the ones that can connect reliable data with sound judgment and practical action.
Performance Analytics FAQ
Business intelligence is a broad category that includes reporting, data visualization, dashboards, and tools for exploring business data. Performance analytics is more specifically focused on evaluating results, understanding their drivers, and improving future performance. Performance analytics may use BI tools, but it usually places greater emphasis on targets, causes, forecasts, and actions.
Performance management is the broader process of setting goals, assigning responsibility, reviewing results, and taking corrective action. Performance analytics provides the data and analysis that supports those activities. Performance management defines what the organization wants to achieve; performance analytics helps determine whether it’s getting there.
There’s no universal set. The right metrics depend on the organization’s goals, operating model, and users. Strong metric systems usually include a mix of outcome measures, such as revenue or retention, and driver measures, such as pipeline quality, product adoption, or delivery reliability.
Enough to provide a balanced view, but not so many that priorities become unclear. A focused team scorecard may contain a small number of primary KPIs supported by more detailed diagnostic measures. The exact number matters less than whether each KPI has a clear purpose.
Not by itself. Many performance analyses identify correlations or patterns. Establishing causation usually requires controlled experiments, quasi-experimental methods, or strong causal analysis. Analysts should be careful not to present association as proof.
No. Many valuable performance analytics programs rely on reliable data, clear definitions, simple calculations, and thoughtful visualization. AI can improve forecasting, anomaly detection, and automation, but it won’t compensate for weak data or unclear business questions.
Start with the decisions or processes the analytics is intended to improve. Measure changes such as reduced downtime, improved conversion, lower churn, faster reporting, better forecast accuracy, or lower operating cost. Compare those benefits with technology, staffing, implementation, and maintenance costs.
Common causes include unclear objectives, poor data quality, inconsistent metric definitions, weak executive support, lack of user involvement, and insufficient attention to adoption. Many projects also fail because they focus on producing dashboards rather than improving decisions.
It depends on how quickly the underlying process changes and how soon users can act. Fraud detection may require real-time data. Sales pipeline analysis may need daily updates. Strategic performance may be reviewed monthly or quarterly. Faster isn’t always better.
It can contribute, but it shouldn’t be the only input. Employee performance is contextual and often includes qualitative factors that aren’t captured well by activity metrics. Analytics should support fair judgment rather than replace it.
One of the biggest risks is using a convenient metric as a substitute for a complex outcome. When people are rewarded or punished based on an incomplete measure, they may optimize the metric while damaging the underlying objective.
Start with one important decision or performance problem. Define the desired outcome, identify the users, agree on the relevant metrics, and determine which data is required. Build a focused solution, measure its impact, and expand from there.
Performance analytics works best when it begins with a real business need rather than a broad ambition to collect more data.