

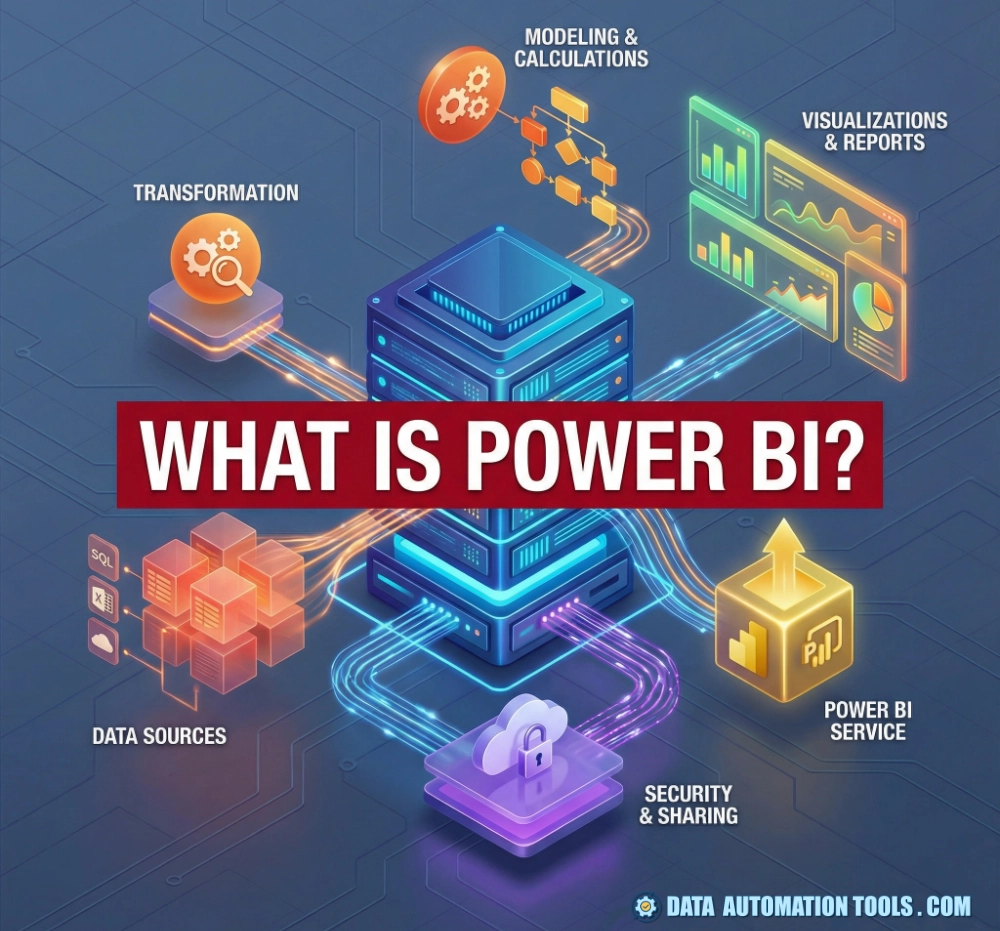
Few tools in the data world generate as much simultaneous enthusiasm and eye-rolling as Microsoft Power BI. For some teams, it’s the fastest path from raw data to real business value. For others, it’s a data sprawl at its worst: a tangled ecosystem of datasets, reports, and workspaces that can spiral into chaos if left unchecked.
The truth, as usual, sits somewhere in between. For IT professionals evaluating analytics platforms, Power BI is less a single product and more a full analytics operating system—one that can be remarkably powerful when implemented thoughtfully.
The biggest reason it dominates so many organizations is simple: accessibility. If you already live in the Microsoft universe—and most enterprises do—it feels less like a new platform and more like a natural extension of tools people already know. It integrates seamlessly with Excel, SharePoint, Teams, Azure, and SQL Server. That tight ecosystem fit is its killer feature.
How is Forecasting Done In Power BI?
Forecasting is one of those features that looks simple on the surface and gets quietly powerful the more you understand it. At the basic level, the platform can generate forecasts directly inside line charts using built-in time series algorithms. You feed it a historical dataset with a clear date axis, click the Forecast option, and it projects trends forward with configurable confidence intervals. Under the hood, Power BI relies on statistical models that analyze seasonality, patterns, and outliers to estimate future values. For more advanced scenarios, analysts can build custom forecasting logic using DAX measures or connect it to machine learning models in Azure Machine Learning or Python scripts for sophisticated predictive analytics. The key limitation is data quality—forecasts are only as good as the history behind them. When your data is clean, consistent, and properly modeled, forecasting can turn ordinary dashboards into forward-looking decision tools instead of rearview mirrors.
Power BI Pricing
Pricing is another major win. Compared with competitors like Tableau or Looker, Power BI often comes in dramatically cheaper—especially for organizations already paying for Microsoft 365 licenses. The per-user Pro tier is inexpensive, and Premium capacity provides enterprise-scale deployment without forcing every viewer into costly licenses. For budget-conscious IT departments, that matters.
It’s pricing is deliberately flexible, which is part of its appeal — but that flexibility can also feel like navigating a menu with too many choices. At the base level, Desktop is free: analysts can build reports, connect to data, and explore models without paying a dime. To share those reports with others, you need Pro, a per-user subscription that unlocks publishing, collaboration, and app workspaces. For organizations with a lot of users or large datasets, Premium steps in with capacity-based pricing, higher refresh rates, and advanced features like paginated reports and AI capabilities. Premium can be licensed per capacity or per user (Premium Per User), giving teams flexibility in how they scale.
The real nuance is understanding how refresh frequency, model size limits, and user roles interact with these tiers — teams that plan ahead can often optimize spend by mixing Pro and Premium Per User licenses rather than committing upfront to full capacity pricing. In short, Power BI’s pricing can be highly cost-effective, but you want a strategy, not just defaults.
Power BI Service
Power BI Service is the hub that turns individual files into shared, governed analytics, and it’s here that Power BI stops being a desktop analytics tool and becomes a true enterprise platform. While Desktop is where data analysis builds the models and charts, Power BI Service is where that insight is consumed, shared, and collaborated on.
From an IT perspective, this is where identity management, permissions, data gateways, and distribution all come together. Teams can publish reports, set up automated refresh schedules, manage row-level security, and monitor usage metrics to see what people actually rely on. The Service also enables collaboration, allowing multiple users to work from the same centralized datasets instead of emailing files around like it’s 2005. In short, Power BI Service is the operational backbone of the ecosystem—without it, Power BI is just a clever visualization app; with it, it becomes a company-wide collaboration and decision platform.
Power BI’s Strengths
From a usability standpoint, Power BI lowers the barrier to entry in a way few analytics tools can match. Business users can build dashboards with drag-and-drop visuals, connect to dozens of data sources, and publish reports without writing a line of code. At the same time, technical users have access to DAX, Power Query (M), and advanced data modeling. That blend of self-service and professional-grade capabilities is what makes Power BI so attractive to mixed IT and business teams.
Under the hood, itrevolves around a few core components. Power Query handles data ingestion and transformation, allowing users to clean and shape data before it ever hits a dashboard. The data model acts as a semantic layer where relationships, measures, and business logic live. DAX (Data Analysis Expressions) powers advanced calculations. And Power BI Service manages publishing, sharing, and governance.
This architecture is both a strength and a source of confusion. The platform can operate in several modes: importing data into in-memory models, connecting live to databases, or using DirectQuery to query sources on demand. Each option has tradeoffs around performance, freshness, and cost. For IT teams, choosing the right pattern is critical. A poorly designed DirectQuery report can cripple a database; an oversized import model can become impossible to refresh.
When implemented correctly, though, the platform scales impressively. Large organizations routinely deploy centralized datasets that feed hundreds of reports, providing a single source of truth while allowing decentralized creativity on top.

Power BI’s Weaknesses
No review would be honest without addressing the rough edges. Power BI’s greatest weakness is governance. Because it’s so easy to build and publish content, many organizations end up with a wild west of overlapping datasets, duplicate metrics, and conflicting dashboards. Without strong standards, “self-service BI” quickly becomes “self-service confusion.”
The learning curve for advanced usage is steeper than it first appears. While basic charts are easy, mastering DAX can feel like learning an entirely new programming language. Complex measures, time intelligence, and performance tuning require real expertise. IT teams often underestimate the skill investment needed to run Power BI at scale.
Another pain point is version control and development workflow. Power BI Desktop files are binary artifacts, not easily managed in Git like code. Collaborative development can be clunky compared with more engineering-oriented analytics platforms. Microsoft has made improvements here, but it still lags behind tools designed with software practices in mind.
Performance management can also be tricky. Large models, inefficient DAX, or overuse of DirectQuery can lead to sluggish reports that frustrate users. Unlike pure cloud-native BI tools, this tool gives you plenty of rope to hang yourself with.
The Microsft Ecosystem
Power BI rarely lives alone. In most enterprises it forms part of a broader Microsoft data stack. Azure Synapse, SQL Server, and Azure Data Lake frequently serve as back-end data sources. Data preparation often happens in Azure Data Factory or dbt, with Power BI handling the presentation layer.
Power Automate is commonly paired with Power BI to trigger workflows based on data events. Excel remains the unofficial companion app, allowing analysts to export, explore, and prototype before formalizing dashboards. For embedded analytics, the platform offers APIs and white-label options that let organizations deliver reports directly inside custom applications.
This ecosystem integration is one of Power BI’s most compelling arguments. It doesn’t just visualize data—it plugs into identity management, collaboration tools, and cloud infrastructure that many companies already depend on.
Risks IT Teams Need to Manage
Deploying the platform successfully is less about the tool and more about discipline. The biggest risk is uncontrolled sprawl: hundreds of datasets with slightly different definitions of revenue, customers, or margins. Without a curated semantic layer and clear ownership, dashboards multiply while trust declines.
Security is another area that demands attention. Power BI supports row-level security, data classifications, and Azure Active Directory integration, but these features must be designed intentionally. Exposing sensitive data through a poorly configured report is easier than most people realize.
Cost management also requires planning. While entry pricing is low, Premium capacity and large data refreshes can become expensive if not monitored. IT teams need clear policies on when to use import models, when to connect live, and how often data should refresh.
Who Power BI Is Best For
Power BI shines brightest in organizations that want broad analytics adoption without massive budgets. Mid-size companies, Microsoft-centric enterprises, and teams looking for rapid time to value often find it to be the perfect balance of power and practicality.
It’s especially strong when paired with a modern data warehouse and a disciplined modeling approach. Used as a front-end visualization layer on top of governed data, this is a platform that becomes a formidable analytics engine.
Where it fits less well is in environments that demand strict software-engineering workflows, extremely complex data transformations inside the BI tool itself, or highly customized user experiences beyond standard dashboards.
The Nitty Gritty
Power BI is not the flashiest analytics platform, nor the most elegant from a pure engineering standpoint. But it may be the most pragmatic, and if your orgsanization’s already plugged in to the Microsoft macrocosm (the Microsoftocosm?), Power BI’s extensibility is smooooth. It delivers an impressive combination of affordability, accessibility, and enterprise capability that few competitors can match.
For IT nerds, the key takeaway is this: this is a powerful tool, but it’s not self-governing. Success depends on architecture, standards, and education as much as on features. Implemented thoughtfully, it can become the backbone of an organization’s data culture. Implemented carelessly, it becomes just another folder full of conflicting reports.
Power BI FAQs
Power BI includes three main parts: Power BI Desktop for building reports, Power BI Service for sharing and governance, and Power BI Mobile for viewing on devices. Together they form a full analytics platform, not just a visualization tool.
Power BI can connect to hundreds of sources—databases, cloud services, APIs, and files. Connections can be import-based (data stored in Power BI) or live/DirectQuery, where queries run against the source system in real time.
Power BI Pro is per-user licensing for sharing and collaboration. Premium provides dedicated capacity, larger datasets, more frequent refreshes, and advanced features. Premium Per User offers some Premium capabilities without full capacity costs.
Power BI integrates with Azure Active Directory, supports row-level security, role-based access, and data classifications. Security is strong, but it requires proper configuration and governance to prevent data oversharing.
Yes—when architected correctly. Using centralized datasets, dataflows, and Premium capacity, Power BI can support thousands of users and very large models. Poor design, however, can quickly create performance problems.
Power BI is less ideal for heavy custom applications, extremely complex data engineering inside the BI layer, or environments requiring strict code-based version control. It works best as a governed visualization and reporting platform on top of a strong data foundation.
Basic DAX is straightforward, but advanced DAX can be challenging. Complex calculations, time intelligence, and performance tuning require real expertise, which is why many organizations invest in formal training.