

You know the old saw Garbage in, garbage out. It couldn’t find a better application than to the need for rigorous data cleaning before visualization. 9 out of 10 data dentists agree: good data hygiene means proper data cleaning before visualization.
Data visualization tools get all the glory for creating beauty out of bytes, but the real heavy lifting – the essential ingredient, and the unsung heroism – of data analytics is rigorous data cleaning before visualization, one of the most important components of data transformation.
This cleaning and transforming prep happens long before the first bar chart appears. Because if the underlying data is messy, inconsistent, or misunderstood, even the most elegant visualization will tell the wrong story. Good analytics always begins with good data hygiene.
What Does The Process of Data Cleaning Entail?
Effective data transformation involves ensuring a number of core components are consistent across systems and processes at the organizational level. This work is a combination of intention, attention, and automation. The former two are brought to bear by the humans (and let’s not forget the developers and engineers) of an organization. Once this semantic layer is established, automation is given over to data cleaning tools. You can find the very helpful (if I do say so myself) piece I’ve written on The 9 essential data cleaning tools here.
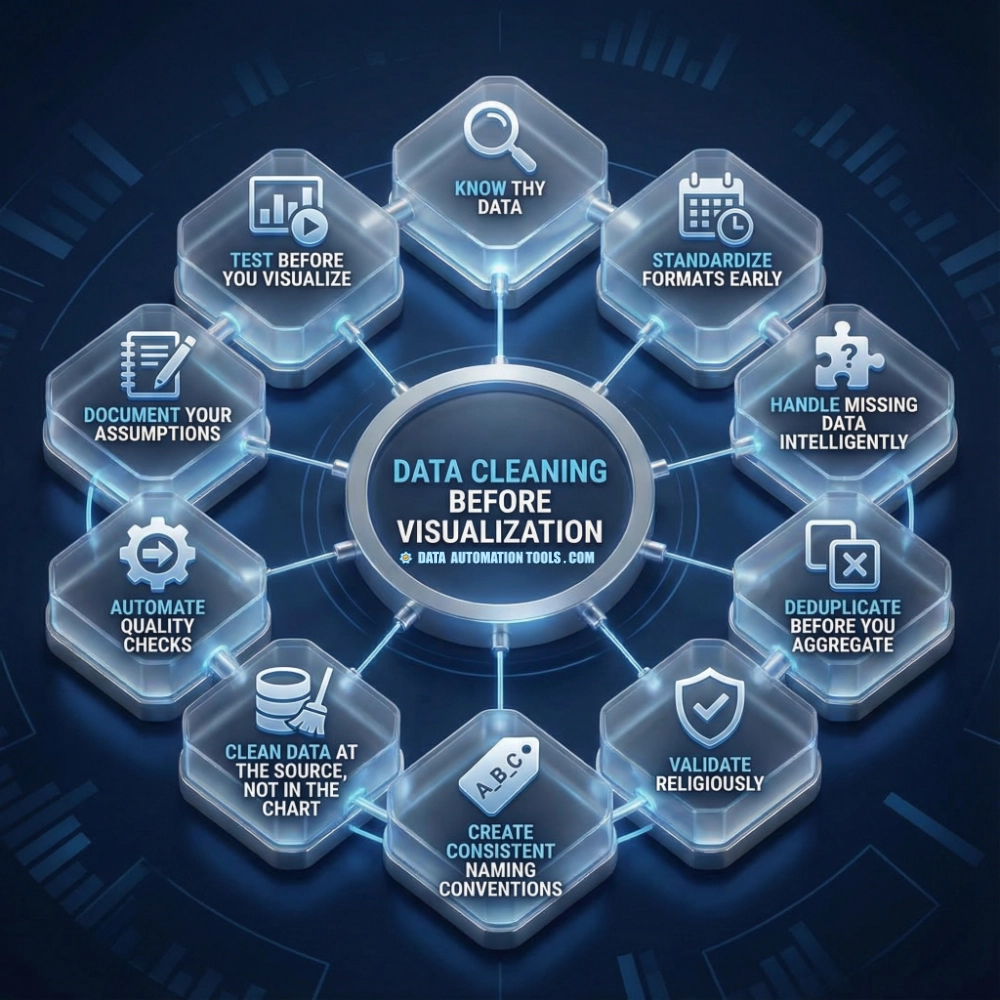
The process of data cleaning before visualization creates trustworthy, consistent datasets that make dashboards accurate, credible, and useful. Over the years I’ve refined a list of what this process entails down to ten essential components. Here it is, for your consideration.
- Know thy Data: The first and most overlooked step in cleaning data is simply learning what you actually have. Before writing any transformation code, explore the raw tables. Many analytics disasters aren’t caused by bad SQL—they’re caused by misunderstandings about how the data was collected in the first place.
- Standardize Formats Early: Real-world data arrives in every possible shape: multiple formats, random punctuation, currency mixes, extra spaces, etc. Normalizing formats is one of the fastest ways to improve quality. Clean, predictable formats make transformations easier and visualizations far more reliable.
- Handle Missing Data Intelligently: Empty fields are everywhere, and they rarely mean the same thing, so treating all missing data identically leads to misleading results. Decide deliberately how each case should be handled and document those choices.
- Deduplicate Before You Aggregate: Duplicates are the silent killers of analytics. If you don’t address duplicates early, they quietly inflate totals and distort trends. Before calculating any serious metrics, define what makes a record a truly unique single instance store, and add deduplication logic to enforce it.
- Validate Religiously: A surprising amount of bad reporting comes from simple type problems: numbers stored as text, dates saved as strings, or booleans represented as “yes” and “no.” Be strict about data types.
- Create Consistent Naming Conventions: Inconsistent field names create confusion and slow development; without standards, every report becomes a guessing game. Establish simple, predictable naming rules and stick to them across all tables and pipelines.
- Clean Data at the Source, Not in the Chart: Surprising, but true: one of the biggest mistakes teams make is fixing data problems inside individual reports. Use ETL tools, transformation scripts, or platforms like dbt to standardize information once and reuse it everywhere.
- Automate Quality Checks: Build tests into your data pipelines: check for missing required fields, alert on sudden spikes or drops, and verify that values fall within expected ranges. Treat data quality the way you treat code quality—with repeatable checks and monitoring. The more you automate, the fewer unpleasant surprises you’ll face.
- Document Your Assumptions: Every cleaning project involves judgment calls: which records to exclude, how to treat edge cases, what definitions to use. Write those decisions down. Future developers and analysts need to know why the data looks the way it does. Clear documentation turns tribal knowledge into organizational memory.
- Test Before You Visualize: Before connecting a dataset to a BI tool, sanity-check the results. Compare aggregates to known totals, spot-check random records, and reconcile numbers with other systems. If the raw data doesn’t make sense, the dashboard won’t either. Validation is the final step that turns cleaned data into trusted insights.
Why Clean Data Before Visualization?
The ultimate goal of data cleaning before visualization is simple: create information people can trust. Cleaning transforms raw, inconsistent, and unreliable data into structured, accurate, and understandable datasets that reflect reality. When data transformation is done well, dashboards become dependable decision-making tools rather than colorful guesswork.
When it fails, the consequences spread quickly. Reports contradict each other, totals don’t reconcile, trends mislead, and leaders make expensive choices based on flawed numbers. Confidence erodes, adoption drops, and developers spend their time defending charts instead of building value. Visualization amplifies whatever quality already exists. Clean data produces clarity; dirty data produces chaos. Always.
What Makes Data Clean (or Dirty)?
Clean data is data that’s accurate, consistent, complete, and structured in a way that can be reliably analyzed. It follows clear standards for formats, naming conventions, and data types, so dates look like dates, numbers behave like numbers, and categories mean the same thing everywhere they appear. Data cleaning before visualization ensures you’ve removed duplicates, unnecessary gaps, and conflicting definitions, and it has been validated against business rules and common-sense expectations. Most importantly, clean data is predictable—analysts and applications can depend on it to produce the same results every time. When data meets those conditions, it becomes a stable foundation for reporting, automation, and confident decision-making.
The Ultimate Goal of Data Cleaning: Trust
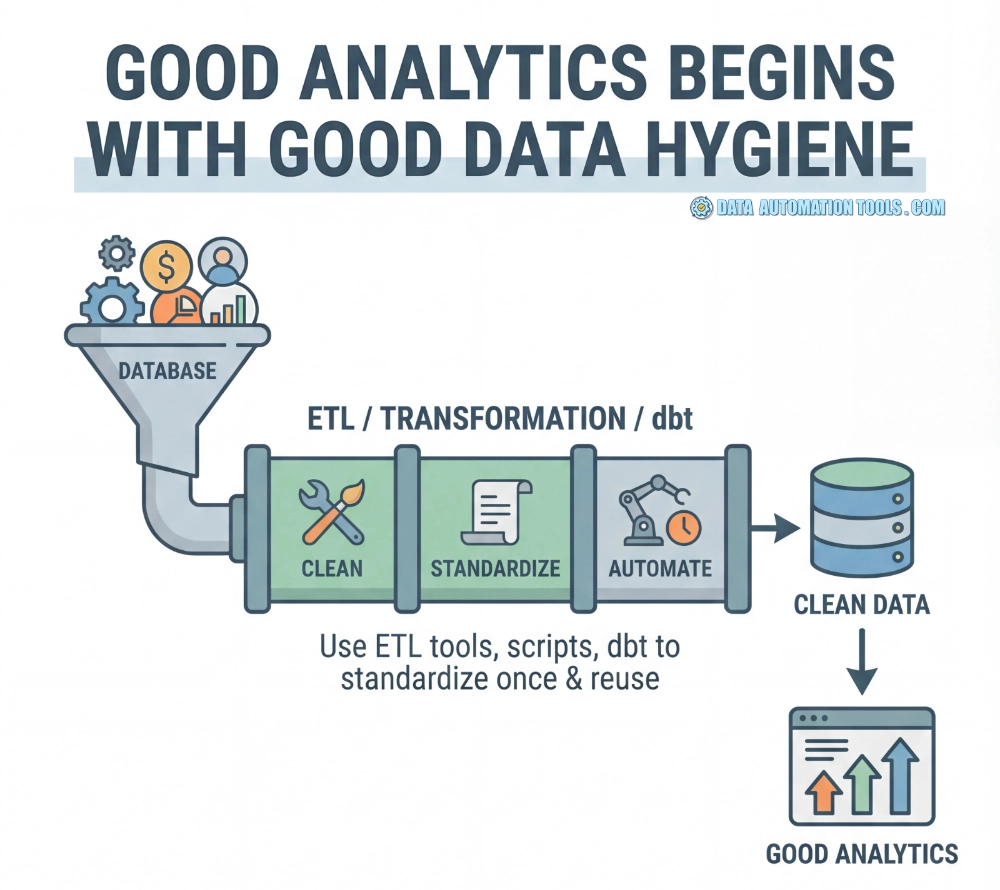
Trusting your data is the ultimate goal of cleaning it before visualization. Charts and dashboards are only as reliable as the numbers beneath them. Rigorous data cleaning before visualization removes errors, inconsistencies, duplicates, and confusing definitions so results remain stable and repeatable.
When stakeholders believe the data, they act confidently and quickly. When they do not, even beautiful reports create doubt and delay. Clean data builds credibility, clarity, and confidence, the true foundation of meaningful analytics. Always worthwhile.
Data Cleaning FAQs
Cleaning in the visualization layer leads to inconsistent logic across dashboards. Fixing data upstream—in ETL, dbt models, or the warehouse—creates one trusted source instead of dozens of one-off patches.
Start with basic profiling: null rates, value ranges, duplicate counts, and data types. Understanding what’s actually in the data prevents bad assumptions and wasted transformation work.
Don’t blindly replace them. Decide whether null means zero, unknown, or not applicable, and treat each case accordingly. Honest nulls are better than invented numbers.
Define a true unique key for each dataset and deduplicate as early as possible in the pipeline. Aggregating before deduplication is one of the most common causes of inflated metrics.
The more strict the better the output. Enforce consistent types during ingestion, explicitly cast fields, and validate inputs. Type mismatches are a major source of broken filters and incorrect calculations.
Definitely. Add validation tests and quality checks to pipelines so problems are caught automatically. Manual cleaning doesn’t scale and quickly becomes unreliable.
When core metrics reconcile with known systems, duplicates are handled, types are consistent, and edge cases are documented. Perfection isn’t required—predictability and trust are.