A Remote Diagnostic Agent Is A Debugger That Never Sleeps
You know that feeling when something in production breaks, but the logs are just vibes and SSH access is off-limits? That’s when you realize you’re living in the age of the Remote Diagnostic Agent — the little daemon quietly watching your systems, collecting telemetry, and whispering sweet stack traces into your observability dashboards.
No, it’s a not a tech wizard beamed in from an overseas call center. Think of it as a digital mechanic, always listening for weird noises in your infrastructure engine. Except instead of oil leaks, it’s catching memory leaks. And instead of asking you “when’s the last time you updated this thing?”, it just fixes it — or at least tells you how.
What Is a Remote Diagnostic Agent?
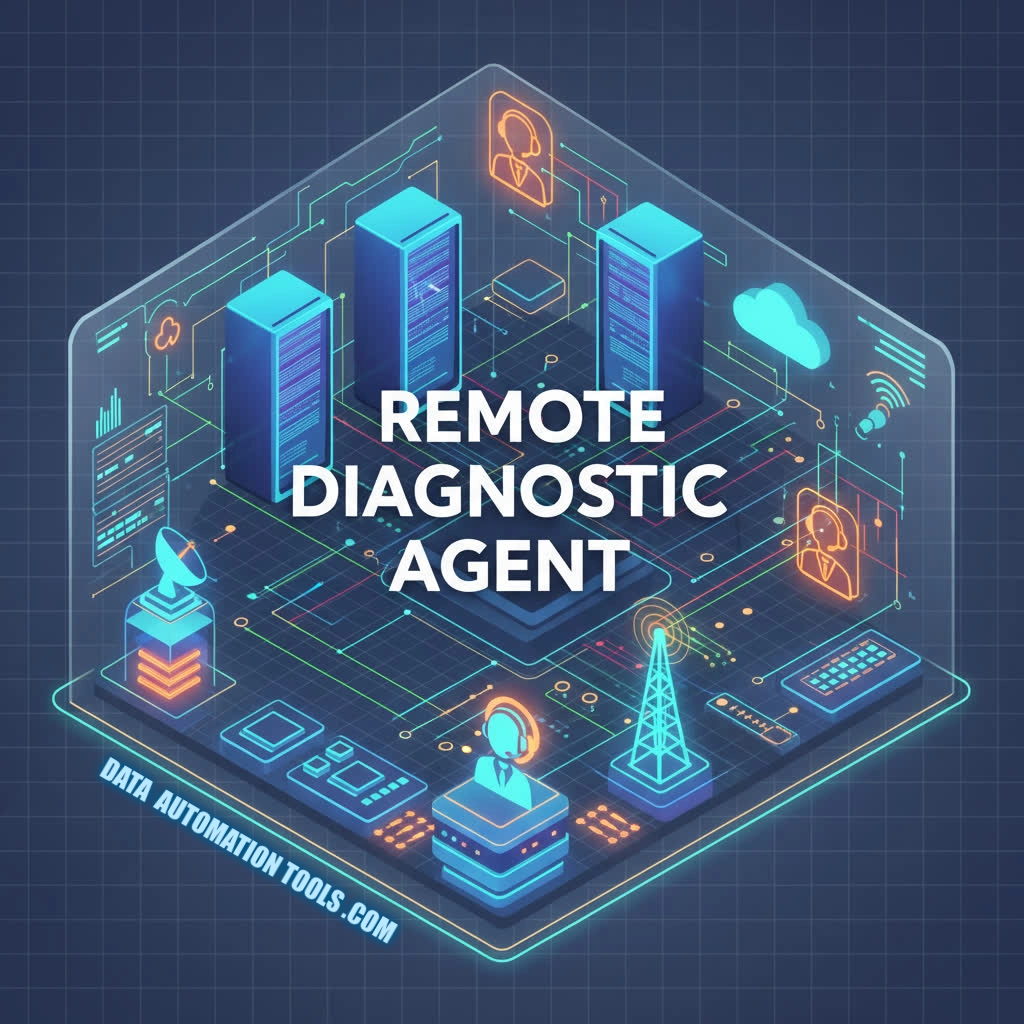
In plain English, a Remote Diagnostic Agent (RDA) is software that lives inside your systems — servers, containers, IoT devices, VMs, whatever — and continuously monitors, inspects, and reports their health.
It’s the secret sauce behind modern support ecosystems. AWS has one. Oracle has one. Cisco, too. It’s how vendors and platform teams peek into complex, distributed environments without hopping on a Zoom call to say “can you share your screen and open the logs?”
In short: RDA = always-on telemetry + remote visibility + automated triage.
It bridges the gap between system metrics and human diagnosis. Instead of guessing what’s wrong, you get structured insights from the inside out — CPU states, network topology, config drift, process anomalies, all in one feed. It’s a lightweight, continuously running, self-updating process that collects system telemetry, performs health checks, and sends actionable diagnostics to a central platform — securely, remotely, and in real time.
The Old Way: The Screenshot Shuffle
Once upon a time, diagnosing an issue remotely meant a chaotic dance between support engineers and sysadmins. Someone filed a ticket, someone else asked for logs, and three days later someone realized the system time was wrong and all the logs were useless anyway.
You’d SSH into a box, tail the logs, copy-paste stack traces into Slack, and pray the issue reproduced. That approach worked when you had ten servers and one mildly caffeinated SRE. But in 2025, when your infrastructure looks like a galaxy of Kubernetes pods across five clouds, manual troubleshooting just doesn’t scale.
Remote Diagnostic Agents solve that by embedding the detective in the system. They’re always on, always listening, and always ready to send back forensic detail — no frantic midnight Slack messages required.
How A Remote Diagnostic Agent Works
The magic of an RDA lies in its architecture — part telemetry pipeline, part automation framework.
Here’s a simplified look at what happens when it’s running:
- Local Data Collection: The agent taps into system APIs, kernel metrics, application logs, and configuration files. Think CPU utilization, disk I/O, service uptime, SSL cert age, dependency versions — all that juicy data you wish someone kept tidy.
- Health & Policy Checks: It runs local scripts and probes (often written in YAML, Python, or Lua) to check system state against a known baseline or compliance profile.
- Anomaly Detection: Using heuristics or machine learning (depending on how enterprise your vendor wants to sound), it detects drift, latency spikes, or suspicious patterns.
- Secure Reporting: It packages results into a lightweight payload — usually JSON over TLS — and sends it to a central diagnostic service.
- Remote Actions: Some agents support two-way communication, meaning a remote engineer can trigger deeper diagnostics, collect traces, or even patch a config — all without touching the box manually.
That’s the beauty of it: visibility without intrusion.
Real-World Examples
- Oracle Remote Diagnostic Agent (RDA): The OG. A command-line utility that gathers system configuration and performance data for Oracle support. Think of it as your DBA’s black box recorder.
- AWS Systems Manager Agent (SSM): Installed on EC2 instances and on-prem servers, it gives AWS the power to inspect, configure, and patch resources remotely. It’s RDA meets remote control.
- Cisco DNA Center’s Diagnostic Agent: Focused on networking. It tests connectivity, checks firmware health, and automatically sends diagnostic packets to Cisco’s cloud.
- Custom DevOps Agents: Many teams build their own — lightweight Go binaries that monitor microservices and report anomalies back to Grafana, Datadog, or OpenTelemetry. Because who doesn’t want their own agent army?
Why Engineers Actually Like RDAs
Normally, “remote” and “diagnostic” sound like red flags for privacy and control freaks alike. But for engineers, RDAs are low-key lifesavers. You get:
- Instant context when something fails — no more hunting through logs from last Tuesday.
- Repeatable, scriptable diagnostics that eliminate guesswork.
- Reduced MTTR (mean time to resolution) because the agent catches issues before users do.
- A paper trail for compliance, since all diagnostics are versioned and auditable.
Plus, it’s the rare enterprise tool that actually helps developers instead of just generating tickets about their mistakes.
The Downsides To A Remote Diagnostic Agent
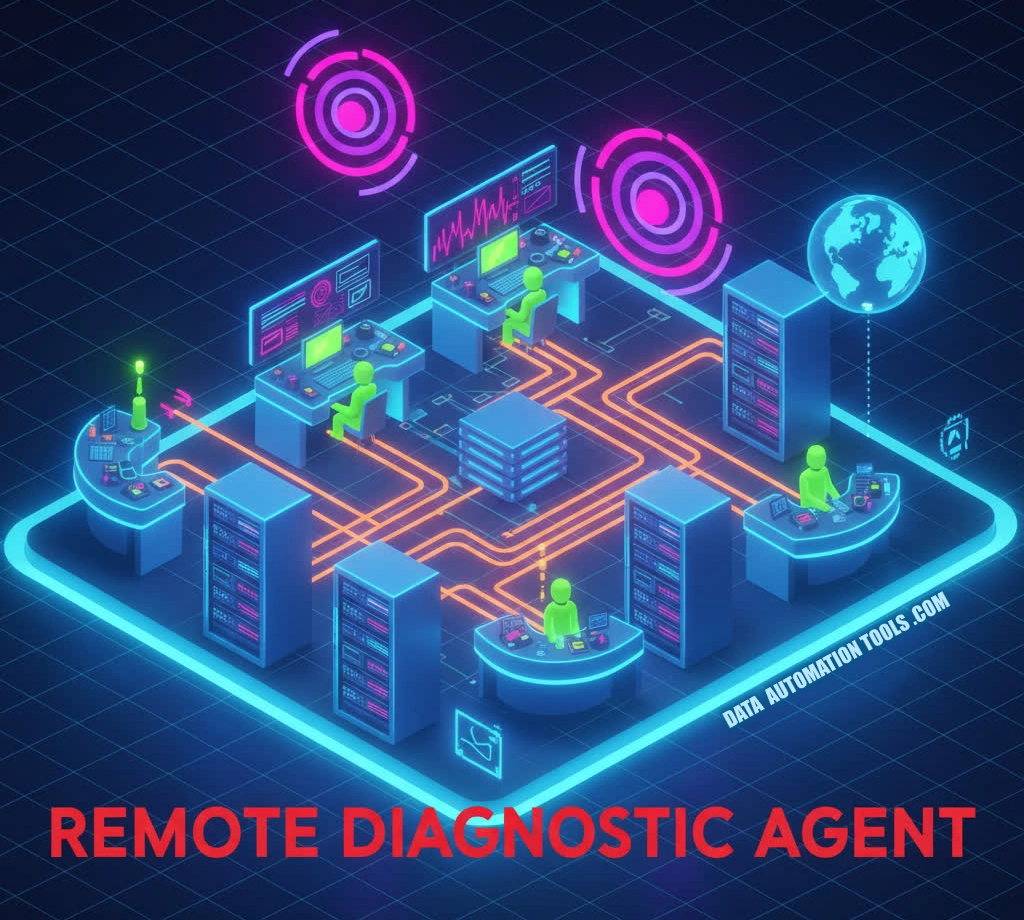
RDAs walk a fine line between helpful and horrifying. A badly configured agent can:
- Overcollect and flood your telemetry pipeline.
- Leak sensitive data (looking at you, debug-level logs).
- Or worse — open a remote execution surface bigger than your attack budget.
You need strict IAM roles, TLS everywhere, and real paranoia about who can trigger remote actions. And then there’s the human factor: once people know “the agent will catch it,” they start trusting it too much. The moment you turn it off, chaos returns like it never left.
Professor Packetsniffer Sez:
Remote Diagnostic Agents are the unsung heroes of the modern stack. They’re the quiet, invisible engineers running diagnostics while you’re asleep — and occasionally sending back more data than you know what to do with. They’re not flashy. They’re not trendy. But they’ve quietly redefined what it means to observe and maintain complex distributed systems at scale.
If observability is your telescope, an RDA is your microscope. It doesn’t just show you what’s happening — it shows you why. And in a world where uptime is currency and outages are public shaming events, that’s worth every kilobyte of telemetry they send home.

