DAG aka Directed Acyclic Graph

A DAG — Directed Acyclic Graph — is the secret sauce of data orchestration, the invisible scaffolding behind your pipelines, workflows, and machine learning jobs. And if you hang around data engineers long enough, you’ll hear them talk about DAGs the way guitar nerds talk about vintage amps — reverently, obsessively, and occasionally with swearing.

A DAG is basically a flowchart with commitment issues. It connects tasks in a specific order — each task pointing to the next — but never loops back on itself. (That’s the acyclic part. If it loops, congratulations, you’ve built a time machine or an infinite while loop. Either way, someone’s pager is going off at 3 a.m.)

A DAG Creates Order in a Sea of Chaos

In a world where every tool wants to be “event-driven” or “serverless,” DAGs are refreshingly concrete. They say, “Do this, then that, but only after those two other things are done.” It’s structure. It’s logic. It’s your data engineer finally getting to sleep because Airflow stopped running tasks out of order.

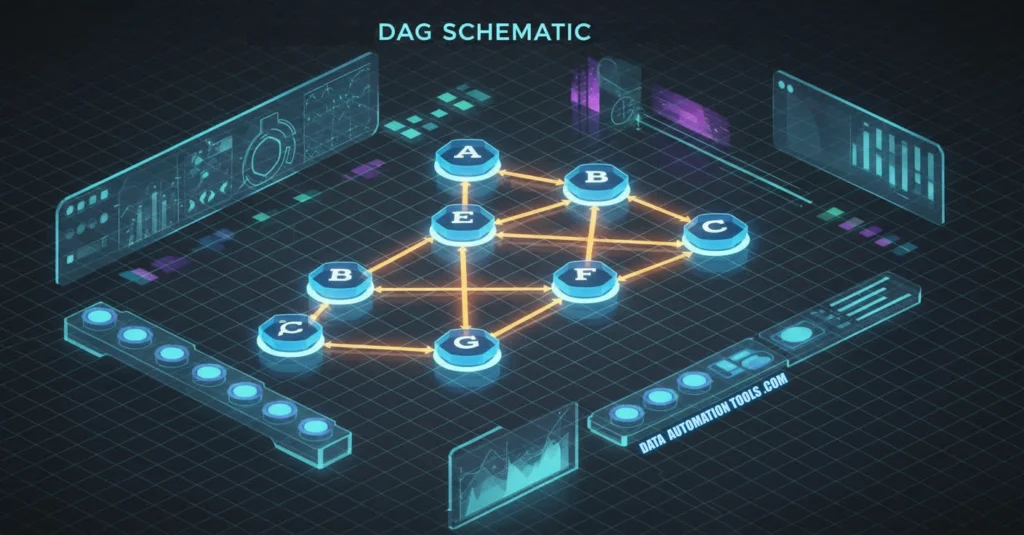
Every DAG is made up of nodes (tasks) and edges (dependencies). You might have a simple one:

ExtractTransformLoad

Or something that looks like a plate of linguine: dozens of parallel branches converging into a final aggregation step. The point is, DAGs give you control — over sequencing, dependencies, retries, and scheduling.

Without DAGs, your workflows are chaos. With them, they’re predictable chaos, which is really the best you can hope for in data engineering.

The DAG Hall of Fame

PlatformDAG StyleDeveloper Mood
Apache AirflowPython-defined, cron-powered“It works until it doesn’t.”
PrefectPython-native, cloud-first“Less YAML, more joy.”
DagsterType-safe, declarative, nerdy in a good way“We do data engineering properly.”
LuigiOld-school, dependable“Still works after 10 years. Respect.”

DAGs show up everywhere — not just in orchestration tools. Machine learning pipelines, build systems (like Bazel), even CI/CD tools (like GitHub Actions) use DAGs under the hood. Once you start seeing them, you can’t unsee them.

Why Engineers Love Them (and Hate Them)

Engineers love DAGs because they make complex workflows understandable. They’re visual logic. You can open a graph view in Prefect or Airflow and literally watch your data move — extraction, transformation, loading, alerts. It’s satisfying, like watching trains hit all the right stations on schedule.

But DAGs are also the source of much developer pain. One bad dependency, and your entire graph halts. Circular references? Nightmare fuel. Misconfigured retries? Endless loops of failure. Debugging a misbehaving DAG feels like therapy — you’re tracing your past mistakes, hoping you’ve finally broken the cycle.

Still, DAGs are indispensable because they represent something deeper: determinism. In a stack full of unpredictable APIs, flaky endpoints, and non-idempotent scripts, DAGs enforce order. They tell your infrastructure, “This is how we do things, every time.”

The DAG Future: Smarter, Dynamic, and Self-Healing

The new generation of tools — Prefect 2.0, Dagster, Flyte — are evolving DAGs beyond static definitions. They’re becoming dynamic, reactive, and sometimes even self-healing. No more hard-coded task graphs — now you can generate DAGs on the fly, respond to upstream data changes, and rerun only what’s broken.

We’re moving toward intelligent DAGs — workflows that understand their own dependencies and recover gracefully. Airflow walked so Dagster could run type checks and Prefect could throw cheeky runtime warnings.

Professor Packetsniffer Sez

DAGs aren’t sexy. They’re not new. But they’re essential. They’re how you keep thousands of moving parts from eating each other alive.

In a world obsessed with “AI everything,” DAGs are a humble reminder that logic still matters. They’re the backbone of reliability in an unpredictable universe — the thing that makes your pipelines reproducible, debuggable, and, dare we say, civilized.

So next time you see a perfect DAG visualization — all green, no retries, no errors — take a screenshot. Frame it. Because that, right there, is the rarest thing in data engineering: peace.

Data Orchestration

Because Cron Jobs Are Not a Strategy

Data orchestration is what happens when your data system grows up, stops freeloading on your dev machine, and gets an actual job. It’s not about being fancy. It’s about making sure the thousand little jobs you set loose every night don’t collide like bumper cars and take your pipeline down with them.

If your data platform looks like a graveyard of half-broken cron jobs duct-taped together with bash scripts and blind faith… congratulations. You’re living the pre-orchestration dream.

And by “dream,” I mean recurring nightmare.

data orchestration

What Even Is Data Orchestration?

Here’s the short version:

  • Data automation is about doing one thing automatically.
  • Data orchestration is about making all those automatic things play nicely together.

It’s the difference between a kid banging a drum and an orchestra playing a symphony. Or more realistically: the difference between you manually restarting jobs at 3 a.m. and you sleeping.

Data orchestration coordinates your ingestion, transformations, validations, loads, alerts, retrains, and dashboards — without you having to manually babysit everything like an underpaid intern.

💬 Automation vs. Orchestration (AKA: One Job vs. Herding Cats)

ThingAutomationOrchestration
What it doesRuns a single jobRuns everything in the right order
Typical vibe“Look, it works!”“Look, it works… reliably.”
Example toolsAirbyte, dbt, BeamAirflow, Dagster, Prefect, Flyte

Automation is a Roomba. Orchestration is the smart home that stops the Roomba from eating your cat.

Why You Can’t Just Wing It

Once your data stack goes beyond a couple of simple scripts, everything turns into a chain reaction waiting to explode.

Think about a real-world pipeline:

  1. You pull data from some fragile API that’s held together with hope and gum.
  2. You load it into a warehouse.
  3. You run dbt transformations that another team wrote and swore “totally work.”
  4. You validate data quality.
  5. You trigger a dashboard refresh.
  6. And then the CEO hits you on Slack asking why the numbers are wrong.

Without orchestration, you’re basically hoping all of those steps happen in the right order and don’t break in the night. Spoiler: they will break in the night. Orchestration lets you declare the order, define dependencies, and not lose your mind every time something fails.

🧠 Developer Tip: DAGs > Cron Jobs

Cron jobs don’t understand dependencies. They’re like goldfish — they just run at their scheduled time and forget everything else. A Directed Acyclic Graph (DAG) actually models relationships between jobs.

Here’s a simple example with Apache Airflow:

from airflow import DAG
from airflow.operators.python import PythonOperator
from datetime import datetime

with DAG("user_data_pipeline", start_date=datetime(2024, 1, 1), schedule_interval="@daily") as dag:
    extract = PythonOperator(task_id="extract_data", python_callable=extract_data)
    transform = PythonOperator(task_id="transform_data", python_callable=transform_data)
    load = PythonOperator(task_id="load_data", python_callable=load_data)

    extract >> transform >> load

See that >>? That’s the sweet sound of not having to manually restart transform jobs because the extract failed again.

What This Looks Like in the Real World

Picture your stack like a map:

Data Sources → Ingestion → Transformation → Validation → Analytics / ML

And perched on top like a caffeine-addled overlord is your orchestrator. It decides:

  • What runs first,
  • What waits its turn,
  • What gets retried, and
  • What lights up your pager when it all goes sideways.

Every step in that flow — whether it’s a Kafka ingestion, a dbt model, or some dusty Python script from 2017 — is a node in your DAG. The orchestrator doesn’t do the work. It tells everything when to do the work and how to recover when your upstream vendor API decides to go on vacation.

🧰 Data Orchestration Tools, Rated Like Coffee Orders

ToolVibeBest For
Airflow“Mature but cranky.”Big batch jobs and legacy chaos
Dagster“Type-safe hipster.”Clean pipelines and data lineage nerds
Prefect“Lightweight and chill.”Startups and cloud-first teams
Flyte“ML-engineer flex.”MLOps and reproducible science projects

All of them can orchestrate workflows. The one you pick depends on whether you want enterprise vibes, developer experience, or something that won’t make you cry during upgrades.

When You Need Data Orchestration (Spoiler: Now)

If you’ve got:

  • More than three pipelines,
  • Data dependencies that look like spaghetti,
  • SLAs that actually matter,
  • Or multiple teams touching the data stack…

…then “a couple cron jobs” is not a strategy. It’s a liability.

Good orchestration means:

  • No downstream corruption when an upstream fails.
  • Better observability, because you can actually see where the fire started.
  • Less time manually kicking jobs, more time pretending to work on “strategy.”

The Developer Experience (a.k.a. Why You’ll Love It)

Modern orchestrators are built for developers, not bored IT admins. You get:

  • Code-first workflows (Python, YAML, DSLs — take your pick).
  • Version control, because your pipeline is actual code now.
  • Testing and simulation, so you can break stuff before prod.
  • Dashboards, because watching DAGs light up is weirdly satisfying.

You can treat pipelines like software components. Deploy with CI/CD. Roll back. Tag releases. You know — real engineering, not pipeline whack-a-mole.

But It’s Not All Puppies and Rainbows

Oh yes, orchestration comes with its own set of headaches:

  • DAG bloat — one day you’ll realize you’ve got 250 DAGs and no one knows what half of them do.
  • Infrastructure overhead — Apache Airflow can eat your ops team alive if left unsupervised.
  • Alert fatigue — enjoy 400 “Job failed” notifications from stuff that doesn’t matter.
  • Upstream drama — if a schema changes, your pretty DAG still faceplants.

The trick is to design intentionally: modular DAGs, clear ownership, and good observability. Also, don’t let Bob from marketing write DAGs.

The Next Evolution: Reactive Data Orchestration

Static scheduling is cute, but the future is event-driven orchestration.

Imagine pipelines that listen for new data, schema changes, or Kafka events and respond dynamically. Tools like Dagster and Prefect are already playing in this space.

Instead of “run every hour,” it’s “run when something actually happens.” Which means less wasted compute, fewer missed SLAs, and more naps for you.

Conduct, Don’t Chase

Data orchestration is the thing that turns your accidental Rube Goldberg machine into a functioning system. It doesn’t process data itself — it conducts the orchestra.

Without it, you’re forever one missed cron job away from dashboard chaos and a “quick” 2-hour firefight. With it, you’ve got:

  • Order,
  • Observability,
  • And the glorious ability to say, “No, it’s in the DAG.”

Data automation builds engines. Data orchestration keeps them from exploding.

Stop duct-taping cron jobs. Start orchestrating.

Data Ingestion

The First Mile of Your Data Pipeline (and the One Most Likely to Explode)

Like it or not, data ingestion is the backbone of every modern data platform — the first mile where all the chaos begins. Let’s be honest: nobody dreams of owning the data ingestion layer. It’s messy, brittle, and one broken API away from ruining your SLA.

If your ingestion layer’s broken, nothing else matters. No amount of dbt magic or warehouse wizardry can save you if your source data never shows up.

data ingestion

What Is Data Ingestion (No, Really)?

At its core, data ingestion is the process of bringing data from various sources into your storage or processing system — whether that’s a data lake, warehouse, or stream processor.

It’s the layer that answers the question:

“How does the data actually get here?”

You can think of ingestion as the customs checkpoint of your data platform — everything flows through it, gets inspected, and is routed to the right destination.

There are two main flavors of ingestion:

  1. Batch ingestion – Move chunks of data at scheduled intervals (daily, hourly, etc.).
    Example: nightly CSV dump from your CRM into S3.
  2. Streaming ingestion – Move data continuously as events happen.
    Example: clickstream data flowing into Kafka in real time.

Most modern systems use both. The mix depends on your latency needs, data volume, and tolerance for chaos.

🧰 Common Data Ingestion Modes

ModeDescriptionExample Tools
BatchScheduled, chunked data loadsApache NiFi, Airbyte, Fivetran, AWS Glue
StreamingReal-time event captureApache Kafka, Flink, Pulsar, Kinesis
Hybrid / LambdaCombines batch + stream for flexibilityDebezium + Kafka + Spark

Batch is like taking a bus every hour.
Streaming is like having your own teleportation portal.
Hybrid is when you’re smart enough to use both.

The Data Ingestion Pipeline: How the Sausage Gets Made

A proper ingestion pipeline isn’t just about moving data. It’s about making sure it arrives clean, on time, and in one piece.

Here’s what a typical ingestion workflow looks like:

  1. Source discovery – Identify where your data lives (APIs, databases, event logs, IoT sensors).
  2. Extraction – Pull it out using connectors, queries, or file reads.
  3. Normalization / serialization – Convert it to a consistent format (JSON, Parquet, Avro).
  4. Validation – Check for missing fields, schema mismatches, or garbage records.
  5. Loading – Deliver it to the destination (lake, warehouse, or stream).

All of that sounds neat in theory. In practice, it’s an obstacle course full of broken credentials, rate limits, schema drift, and mysterious CSVs named final_final_v3.csv.

⚙️ Schema Drift Is the Real Villain

Nothing kills ingestion faster than unannounced schema changes. One day your API returns user_name; the next, it’s username, and half your pipeline silently fails.

To survive schema drift:

In other words: trust, but verify.

Batch vs. Streaming: The Eternal Flame War

Let’s settle this.

Batch ingestion is the old reliable — simple, durable, and easy to reason about. Perfect for periodic reports and slow-moving systems.

Streaming ingestion, on the other hand, is what powers the cool stuff: recommendation engines, fraud detection, and real-time dashboards. It’s also how you triple your cloud bill in a week if you’re not careful.

Most mature data teams end up with a hybrid model:

  • Stream the hot data (events, logs, transactions).
  • Batch the cold data (archives, snapshots, historical pulls).

This gives you the best of both worlds — near-real-time insight without frying your infrastructure.

💡 Real-World Hybrid Example

A typical e-commerce stack might look like this:

  • Kafka handles real-time event streams (user clicks, orders).
  • Airbyte ingests batch data from SaaS sources (Shopify, Stripe).
  • Snowflake serves as the unified warehouse.
  • dbt transforms both into analytics-ready tables.

The orchestrator (Airflow, Dagster, Prefect — pick your flavor) ties it all together, making sure each feed behaves like a responsible adult.

The Architecture: Where It All Lives

Visualize your ingestion layer like a conveyor belt:

Sources → Ingestion Layer → Staging → Transformation → Storage / Analytics

  • Sources: Databases, APIs, webhooks, IoT devices.
  • Ingestion Layer: Connectors, queues, stream processors.
  • Staging: Temporary raw storage in S3, GCS, or Delta Lake.
  • Transformation: Cleaning and modeling (via dbt or Spark).
  • Storage: The final warehouse or analytics system.

This is where the “data lake vs. data warehouse” debate sneaks in — but the truth is, ingestion feeds both. It’s Switzerland. It doesn’t care where the data goes, as long as it gets there safely.

Modern Data Ingestion Tools: The Good, the Bad, and the Overhyped

ToolTypeProsCons
AirbyteBatchOpen source, easy setupStill maturing; occasional bugs
FivetranBatchRock-solid connectors$$$ at scale
KafkaStreamingIndustry standard, robustSteep learning curve
PulsarStreamingCloud-native, multi-tenantSmaller ecosystem
DebeziumCDC / HybridGreat for change data captureComplex config
AWS GlueBatch + StreamIntegrates with AWS stackSlower dev iteration

Every one of these can move data. The question is: how much pain tolerance do you have and how fast do you need it?

Challenges (a.k.a. Why Ingestion Engineers Deserve Raises)

Data Ingestion looks simple until you actually run it in production. Then you discover:

  • APIs with undocumented limits.
  • File formats that make no sense.
  • Inconsistent timestamps that time-travel across zones.
  • Duplicates that multiply like gremlins.

And that’s before the business team asks you to “just add one more source” — meaning another SaaS app that changes its schema every Tuesday.

The biggest challenge isn’t writing the ingestion logic. It’s operationalizing it — monitoring, retrying, alerting, and ensuring data reliability over time.

That’s why good ingestion pipelines:

  • Include dead-letter queues for bad records.
  • Have idempotent writes to prevent duplicates.
  • Implement observability (metrics, logs, lineage).
  • Integrate with orchestration tools for retries and dependencies.

If you’re not monitoring ingestion, you’re not ingesting — you’re gambling.

Future Trends: Smarter, Simpler, and More Real-Time

The next wave of ingestion is all about intelligence and automation. Expect:

  • Event-driven pipelines that respond instantly to changes (no more hourly cron).
  • Schema-aware ingestion that automatically adapts to source updates.
  • Serverless ingestion where you pay only for processed events.
  • Unified batch + stream frameworks like Apache Beam and Flink bridging the gap.

The goal? Zero-ops ingestion.
Just point, click, and stream — without the yak-shaving.

Final Thoughts

Data ingestion is the least glamorous but most essential layer in your stack. It’s the plumbing that makes everything else possible — the quiet hero (or silent saboteur) of your data system.

When it’s done right, nobody notices. When it fails, everyone does.

So treat your ingestion like infrastructure.
Give it observability, testing, retries, and respect.

Because at the end of the day, your analytics, ML models, and dashboards are only as good as the data that got there — and the pipeline that survived the journey.

Or as one seasoned data engineer put it:

“You can’t transform data that never showed up.”

Data Transformation

Every data engineer knows the feeling: your ingestion jobs worked, the warehouse is full, and now you’re staring at a swamp of raw tables named things like event_log_final_v2_copy. Congratulations — you’ve entered the data transformation zone, where raw chaos becomes something humans (and dashboards) can actually understand.

If data ingestion is about getting data in, data transformation is about making it make sense — turning the spaghetti into something structured enough for analytics, ML, and that one VP who insists on “just one more column” every week.

What Is Data Transformation, Really?

At its core, data transformation is the process of converting data from one format, schema, or structure into another. It’s cleaning, reshaping, enriching, and modeling data so it’s usable for downstream systems — like analytics, machine learning, or other pipelines.

It’s the “T” in ETL and the “middle” in ELT — the unsung hero between extraction and loading. And depending on your stack, it’s either happening before your data hits the warehouse (classic ETL) or inside it (modern ELT).

The concept sounds simple. In practice, it’s half janitorial work, half data wizardry. You spend your days normalizing column names, fixing data types, handling nulls, and wondering why “true” sometimes arrives as "TRUE", sometimes as "1", and sometimes as "yes, duh".

data transformation

Common Data Transformation Steps

StepWhat It DoesExample Tools
CleaningRemove duplicates, fix types, handle nullsPandas, dbt, Spark SQL
NormalizationStandardize formats and namingdbt, Airbyte, Glue
AggregationSummarize data into metricsBigQuery, Snowflake, Databricks
EnrichmentAdd context from other sourcesdbt, Trino, Flink
ModelingDefine business logic and analytics tablesdbt, LookML, SQLMesh

Transformation is where your data finally gets personality — where you decide what a “customer,” a “purchase,” or a “session” actually means. It’s the layer that converts raw numbers into stories.

ETL vs. ELT: The Great Data Role Reversal

Once upon a time, we transformed data before loading it into storage — ETL (Extract → Transform → Load). This made sense when warehouses were expensive and slow. You didn’t want to dump raw logs into a system that cost $50 per query.

Then cloud warehouses like Snowflake, BigQuery, and Redshift came along and said, “Nah, just throw it all in here first — we’ll handle it.” Thus was born ELT (Extract → Load → Transform).

Now, you load everything raw into your warehouse, then use SQL-based tools (hello dbt) to model it into clean tables. The benefit? Flexibility and traceability — you keep your raw data, transform it iteratively, and version-control your logic like code.

The cost? Your warehouse bill now looks like a ransom note.

Model Like You Mean It

The most underrated skill in transformation is naming things.
A clean data model reads like documentation.

If your tables are named raw.ordersstg_ordersfct_sales, congratulations, you’re an adult.
If they’re new_orders_finalfinal_orders_v3newest_orders_final_copy, you’re living dangerously.

Tools like dbt, SQLMesh, and Dataform let you modularize transformations, version-control them, and test them. It’s basically software engineering principles — applied to SQL.

Batch vs. Streaming Transformations

Just like ingestion, transformations come in two flavors:

  1. Batch transformations – Periodic, scheduled runs (hourly, nightly, etc.). Best for structured reporting, finance data, and analytics dashboards.
  2. Streaming transformations – Continuous, real-time data reshaping. Essential for clickstream analytics, IoT data, fraud detection, and other “the world is on fire” use cases.

Batch is calm, predictable, and easy to debug. Streaming is adrenaline-fueled, distributed, and always one misconfigured window away from chaos.

Streaming Transformation in the Wild

Imagine a live retail site. Every click, cart update, and purchase flows through Kafka.
You want to compute “active users in the last 5 minutes” — that’s a streaming transformation.

You might use Apache Flink, Spark Structured Streaming, or Materialize to continuously transform event data into aggregates and push them into Redis for real-time dashboards.

It’s like dbt, but on Red Bull.

The Data Transformation Stack

The current data ecosystem has quietly converged around a pattern: ELT + SQL-first transformation + orchestration.

A typical setup might look like this:

  • Ingestion: Airbyte or Fivetran brings data into the warehouse.
  • Storage: Snowflake, BigQuery, or Databricks holds the raw + transformed layers.
  • Transformation: dbt handles SQL modeling, tests, and dependencies.
  • Orchestration: Airflow, Prefect, or Dagster runs the show.

Each piece is modular, composable, and more reliable than the bash scripts of yore (though they, too, walk among us).

dbt — The Poster Child of Data Transformation

dbt (Data Build Tool) revolutionized this layer by treating transformations like code:

  • Write SQL → Compile to DAG → Run it in your warehouse.
  • Add tests, documentation, and versioning.
  • Deploy via CI/CD, not copy-paste.

It’s simple, open, and opinionated — which, in data engineering, is basically religion.

dbt taught teams that data modeling is software engineering, and that clean transformations deserve the same rigor as APIs or microservices.

The Dark Side of Transformation

Of course, with great SQL comes great chaos. Transformation layers often become the dumping ground for every business question nobody planned for.

Before long, you’re managing hundreds of models, half of which depend on columns that no longer exist. Your DAGs look like family trees from a Targaryen wedding.

And because transformations touch everything, one broken model can bring your entire analytics pipeline to its knees.

That’s why testing, version control, and lineage tracking aren’t optional — they’re survival tactics.

Good transformation engineers treat their models like code.
Bad ones treat them like an Excel sheet that got promoted.

Transformation as the Heart of the Data Lifecycle

If ingestion is plumbing, and analytics is storytelling, transformation is the translator between the two — the layer where meaning is made.

It’s also the hardest layer to get right because it sits at the intersection of business logic and engineering discipline. You’re encoding human decisions into structured data. And humans, famously, change their minds every quarter.

That’s why the best transformations are modular, testable, and boring.
Boring is good. Boring is reliable.

The flashy part is what comes after — but the magic starts here.

Final Thoughts

Data transformation is the quiet power move of modern data engineering. It’s where pipelines turn into products, and raw facts become insights.

You can’t visualize, automate, or model what you haven’t transformed.
So take it seriously. Treat it like code. Test it, document it, monitor it.

Because at the end of the day, transformation is where your data stops being “collected” and starts being useful.

Everything else — ingestion, orchestration, analytics — just dances around it.

Flink Review

Real-Time Stream Processing Without the Headaches

If you’ve ever tried to build a real-time analytics pipeline or event-driven application, you know the pain: lagging batch jobs, tangled Kafka consumers, and endless reprocessing logic. For years, developers have looked for a tool that treats streaming data as a first-class citizen — not just an afterthought tacked onto batch systems. Enter Apache Flink.

apache flink

Flink isn’t the newest kid on the block, but it’s quietly become one of the most mature and capable distributed stream processing engines in production use today. If Spark made big data processing popular, Flink made it fast, fault-tolerant, and — crucially — stateful.

Let’s take a developer’s-eye look at what makes Flink powerful, where it shines, and where it can still make you sweat.

What Flink Is (and Isn’t)

At its core, Flink is an open-source framework for stateful computations over data streams. That means it’s designed to process unbounded data — data that keeps arriving — in real time, with exactly-once semantics and low latency.

But unlike batch-first systems like Spark, which later bolted on streaming APIs, Flink was built for streams from day one. That design choice shapes everything about it — from its execution model to its state management.

Flink’s architecture revolves around three concepts:

  1. Streams — continuous flows of data (e.g., events, logs, transactions).
  2. State — intermediate data that persists between events.
  3. Time — event-time processing that respects when events actually happened, not just when they arrived.

That last one is key. Flink’s event-time model allows you to handle out-of-order events and late data — a nightmare in most other systems.

Flink in the Stack

Typical Flink Deployment

RoleTool ExampleDescription
SourceKafka, Kinesis, PulsarStreams incoming data into Flink jobs
ProcessorApache FlinkStateful stream transformations and aggregations
SinkElasticsearch, Cassandra, Snowflake, S3Outputs processed results for storage or analytics

This architecture means Flink sits comfortably in the modern data ecosystem — it doesn’t try to replace Kafka or Spark; it complements them.

Under the Hood: Why Developers Like It

Flink’s claim to fame is its stateful stream processing engine. State is stored locally within operators, allowing Flink to execute computations efficiently without constant I/O to external stores. When things fail — as they inevitably do — Flink uses asynchronous checkpoints and savepoints to restore state seamlessly.

In practice, that means you can process millions of events per second with exactly-once guarantees — and restart jobs without losing progress. Few frameworks pull that off as gracefully.

From an API perspective, Flink gives you two main abstractions:

  • DataStream API — for event-driven applications (Java, Scala, Python).
  • Table/SQL API — for declarative stream analytics with SQL semantics.

The SQL layer has matured significantly over the past few years. You can now write streaming joins, windows, and aggregations with clean, familiar syntax:

SELECT user_id, COUNT(*) AS clicks, TUMBLE_START(ts, INTERVAL '5' MINUTE)
FROM user_clicks
GROUP BY user_id, TUMBLE(ts, INTERVAL '5' MINUTE);

That query continuously computes 5-minute click windows — no batch jobs required.

Stateful Processing Done Right

Flink’s state backends (RocksDB or native memory) let you manage gigabytes of keyed state efficiently. You don’t have to push this state to Redis or an external cache — it’s embedded in the Flink job and checkpointed automatically. That’s a game-changer for use cases like fraud detection, streaming joins, or complex event pattern recognition.

When to Reach for Flink

If you need real-time, high-throughput, and fault-tolerant stream processing, Flink is hard to beat. Common production use cases include:

  • Streaming ETL pipelines — transforming event streams into analytics-ready data in real time.
  • Fraud detection — identifying suspicious patterns across millions of transactions.
  • Monitoring and alerting — generating alerts as soon as anomalies appear.
  • Recommendation systems — powering continuous model updates based on live user behavior.

Flink’s low latency (often in the tens of milliseconds) makes it ideal for these scenarios. And because it supports event-time windows, it gracefully handles late data — something batch-style systems struggle with.

Where Flink Makes You Work

Flink is a power tool, and like all power tools, it comes with sharp edges.

  • Complex setup: Getting Flink running at scale requires tuning task slots, parallelism, checkpoints, and RocksDB settings. The learning curve is steep if you’re new to distributed systems.
  • Cluster management: While it integrates with Kubernetes and YARN, managing scaling and fault recovery across large clusters can get tricky.
  • Debugging: Stateful streaming jobs are inherently harder to debug. When something goes wrong, it’s often buried in distributed logs and operator graphs.
  • Cost of state: Stateful processing is great — until your state grows into the hundreds of gigabytes. Checkpointing and restore times can balloon.

That said, Flink’s community has been closing these gaps fast. The newer Kubernetes Operator simplifies deployment, and the Table API lowers the barrier for teams coming from SQL-based workflows.

Community, Ecosystem, and Maturity

Flink has one of the strongest open-source communities in the data space. Backed by the Apache Software Foundation, with heavy contributions from companies like Alibaba, Ververica, and Netflix, it’s battle-tested at scale.

The ecosystem around Flink — including StateFun for event-driven microservices and FlinkML for streaming machine learning — shows that it’s evolving beyond analytics into a general-purpose stream processing platform.

Documentation, once a weak point, has also improved dramatically, and new users can get started with Flink SQL without writing a single line of Java or Scala.

Flink Verdict

Apache Flink is not the easiest framework to learn — but it’s one of the most technically elegant and production-proven solutions for real-time data processing.

If your workloads involve high-volume streams, complex transformations, or long-running stateful jobs, Flink deserves a serious look. If you just need batch analytics, Spark or dbt will likely serve you better.

But when milliseconds matter — when you want your system to think in streams instead of batches — Flink feels less like a data tool and more like a distributed operating system for events.

It’s not for everyone, but for the developers who need it, Flink is the real deal.

Kafka Review

The Chaos Engine That Keeps the Modern World Streaming

Data pipelines have a pulse, and it sounds like Kafka. Kaf-ka, Kaf-ka, Kaf-ka… Every time you click “buy,” “like,” or “add to cart,” some event somewhere gets shoved onto a Kafka topic and fired down a stream at breakneck speed.

Kafka isn’t new, and it isn’t polite. It’s been around since 2011, born in the wilds of LinkedIn, and it still feels like the piece of infrastructure you whisper about with equal parts respect and trauma. It’s the backbone of modern event-driven architecture, the real-time bloodstream behind everything from Netflix recommendations to your food-delivery ETA. It’s also the reason half of your data team has trust issues with distributed systems.

apache kafka

What Kafka Has (and Why Everyone Wants It)

At its simplest, Kafka is a distributed event-streaming platform. You publish data to topics, and other systems consume those events in real time. Think of it as a giant, append-only log that sits between your producers (apps, sensors, APIs) and your consumers (analytics, ML models, databases). It decouples producers and consumers, guaranteeing scalability, durability, and a nice warm buzzword called fault tolerance.

Kafka is how you stop microservices from yelling directly at each other. It’s the message broker for grown-ups — one that handles millions of messages per second without breaking a sweat (well, most of the time).

The Kafka Ecosystem in One Breath

ComponentRoleTL;DR
Kafka BrokerStores and serves messagesThe heart — holds your data logs
ProducerSends messagesShouts into the void
ConsumerReads messagesListens to the void
ZooKeeper / KRaftCoordinates clustersKeeps brokers behaving
Kafka ConnectIngests/exports dataPipes in and out
Kafka Streams / ksqlDBReal-time processingSQL meets streaming

Kafka’s ecosystem has evolved into a sprawling universe — from low-level APIs to managed cloud services (Confluent Cloud, AWS MSK, Redpanda, etc.). You can run it on bare metal if you enjoy chaos, or let someone else take the pager.

The Kafka Experience: Equal Parts Power and Pain

Using Kafka feels like riding a superbike: fast, powerful, but you’re one bad configuration away from a crater.

The good news: once it’s running smoothly, it’s ridiculously fast and reliable. Topics are partitioned for scalability, replication provides durability, and the publish-subscribe model makes fan-out trivial. You can replay messages, build event sourcing architectures, and stream-process data in real time.

The bad news: setting it up can feel like assembling IKEA furniture while blindfolded. Misconfigured replication? Data loss. Wrong partitioning? Bottlenecks. ZooKeeper outage? Welcome to distributed system hell.

Kafka’s biggest learning curve isn’t the API — it’s the operational mindset. You have to think in offsets, partitions, and consumer groups instead of rows, columns, and queries. Once it clicks, it’s magical. Until then, it’s therapy-fuel.

Respect the Offsets

Offsets are Kafka’s north star. They tell consumers where they are in a topic log. Lose them, and you’re replaying your entire event history.

Pro-move: persist offsets in an external store or commit frequently. Rookie move: assume Kafka “just remembers.”

Batch vs. Stream: The Great Divide

Kafka didn’t just popularize streaming — it made everyone realize batch ETL was basically snail mail.

Before Kafka, you had nightly jobs dumping data into warehouses. After Kafka, everything became an event: clicks, transactions, telemetry, sensor updates. The entire world went from “run once per night” to “run forever.”

Frameworks like Kafka Streams, Flink, and ksqlDB sit on top of Kafka to perform in-stream transformations — aggregating, joining, and filtering events in motion. It’s SQL on caffeine.

This shift wasn’t just technical — it changed the culture. Data engineers became streaming engineers, dashboards became live dashboards, and “real time” stopped being a luxury feature.

Common Kafka Use Cases

  • Real-time analytics – Clickstreams, metrics, fraud detection
  • Event sourcing – Storing immutable event logs for state reconstruction
  • Log aggregation – Centralizing logs from microservices
  • Data integration – Using Kafka Connect to pipe data into warehouses
  • IoT / Telemetry – Processing millions of sensor events per second

Basically, if it moves, Kafka wants to publish it.

Kafka vs The World

Let’s be honest: Kafka has competition — Pulsar, Redpanda, Kinesis, Pub/Sub — all trying to do the same dance. But Kafka’s edge is ecosystem maturity and community inertia.It’s the Linux of streaming. Everyone complains, everyone forks it, nobody replaces it.

That said, newer projects like Redpanda have improved UX and performance, while cloud providers have made “managed Kafka” the default choice for those who’d rather not wrangle brokers at 3 a.m. Kafka’s open-source strength is also its curse — it’s infinitely flexible but rarely simple.

Professor Packetsniffer Sez:

Kafka is a beast — but a beautiful one. For engineers building real-time systems, it’s the most powerful, battle-tested piece of infrastructure around. It’s fast, distributed, horizontally scalable, and surprisingly elegant once you stop fighting it.

The trade-off is complexity. Running Kafka yourself demands ops muscle: tuning JVMs, balancing partitions, babysitting ZooKeeper (or the new KRaft mode). But use a managed provider, and you can focus on streaming logic instead of cluster therapy.

In the modern data stack, Kafka isn’t just a tool — it’s the circulatory system. It connects ingestion, transformation, activation, and analytics into a continuous feedback loop. It’s how companies go from reactive to real-time.

Love it or hate it, Kafka is here to stay. It’s not trendy; it’s foundational.
It’s the middleware of modern life — loud, indispensable, and occasionally on fire.

References

  1. Confluent Blog – Kafka vs Kinesis: Deep Dive into Streaming Architectures
  2. Redpanda Data – Modern Kafka Alternatives Explained
  3. Jay Kreps, The Log: What Every Software Engineer Should Know About Real-Time Data’s Unifying Abstraction (LinkedIn Engineering Blog)
  4. Data Engineering Weekly – Kafka at 10: From Message Bus to Data Backbone

Make.com Review

Make is the Automation Tool for People Who Actually Like to See Their Data Flow. It’s not low-code — it’s logic porn. If Zapier is the friendly robot that hides the wires, Make (née Integromat) is the mad scientist’s lab where you can see the wires, twist them, and occasionally electrocute yourself with joy. Where Zapier holds your hand, Make gives you a control panel and says, “Go ahead, build something beautiful. Or terrifying. Your call.”

make

Make TL;DR

Make is a visual automation platform that connects APIs, webhooks, and SaaS tools into drag-and-drop workflows called scenarios. It’s like Zapier’s power-user cousin — same concept (trigger → action → repeat), but with actual control, modularity, and visibility into what’s happening under the hood.

If Zapier is Excel formulas, Make is the whole spreadsheet engine exposed.

You don’t just connect apps — you manipulate data midstream, transform payloads, add conditional logic, iterate through arrays, and do all the weird little data gymnastics engineers love.


⚙️ Callout: How Make Works (a.k.a. The Anatomy of a Scenario)

ComponentWhat It Does
ModulesThe building blocks — each represents an API call, function, or data operation.
ScenariosThe complete workflow — a series of connected modules.
BundlesThe data packets passed between modules.
IteratorSplits arrays into items for looping (very “for-each” energy).
RouterCreates branching logic — parallel workflows for different conditions.

In practice, a Make scenario looks like a circuit board — nodes, lines, loops, filters. You can see exactly where your data goes, and where it dies a horrible JSON-related death.

What Make Does Right

Make’s brilliance lies in transparency and flexibility. You can click into any node, inspect payloads, and tinker with fields in real time. For developers who want power without spinning up an AWS instance, this is catnip.

You can:

  • Parse JSON like a pro — right inside the UI.
  • Build conditionals, loops, and error handlers visually.
  • Call custom webhooks or arbitrary HTTP endpoints.
  • Transform data mid-flow using functions and expressions.

It’s basically ETL for the people, with a GUI that feels halfway between a flowchart and a data pipeline diagram.

You can chain dozens of apps together — Gmail → Airtable → Notion → Slack → a random REST API — and it actually works.

Example: DIY Data Pipeline

Use Case: Sync customer leads from a Typeform survey to a CRM and a Slack channel.

  • Trigger: New Typeform submission.
  • Step 1: Parse the payload into structured data.
  • Step 2: Enrich the email address via Clearbit API.
  • Step 3: Create or update the record in HubSpot.
  • Step 4: Post a formatted summary in Slack.

In Zapier, this would be 4+ Zaps stitched together.
In Make, it’s one visual scenario with clear data flow and inline transformations.

It’s like watching your workflow come alive — complete with colorful lines, execution counts, and timestamps.

Developer Vibe: Control Freaks Welcome

Let’s be honest — developers don’t love “no-code” tools.
But Make feels like the one exception because it respects the logic brain.

You can write inline expressions, use JSONPath-like references, manipulate text, numbers, and dates. You can even fire off raw HTTP requests when the built-in modules don’t cut it.

It’s like someone took Postman, Node-RED, and Zapier, threw them in a blender, and somehow didn’t ruin the taste.

And because the whole workflow is visual, debugging is weirdly satisfying — you can click any node and see the exact data that passed through it. It’s the automation equivalent of stepping through code with breakpoints.

If Zapier is the automation you give your marketing team, Make is the one you keep for yourself.

Where It Bites Back

Make’s freedom comes with chaos. It’s too powerful for the uninitiated.

The UI, while pretty, is dense — every icon hides a dozen options. You can easily build an infinite loop that nukes your API quotas before lunch.

And because Make exposes so much, it’s easy to over-engineer — to turn what should be a three-step automation into a Rube Goldberg data factory.

Observability is decent but not enterprise-grade. Error handling works, but you’ll occasionally end up spelunking through “execution logs” like a data archaeologist.

Also, some integrations lag behind Zapier’s polish. Zapier’s connectors are pristine; Make’s are sometimes adventurous.

The Learning Curve

New users expect point-and-click simplicity and get a crash course in API payload anatomy. If you’re allergic to expressions like {{formatDate(now; "YYYY-MM-DD")}}, buckle up.

But for devs who already think in requests and JSON, it’s surprisingly intuitive. You just have to unlearn Zapier’s “black box” approach and start thinking like a systems engineer.

Make Pricing and Scale

The pricing is refreshingly transparent — you pay by operations, not tasks. That means you can run high-volume automations without breaking the bank.

And the best part? You can self-host webhooks and even chain Make with other orchestration tools (like Prefect or Dagster) for a hybrid automation stack.

It’s like Zapier for adults — cheaper, more flexible, and 100% more likely to make you feel like a hacker.

Verdict: The Thinking Engineer’s No-Code Tool

Make is what happens when someone builds a no-code tool for people who actually know what an API response looks like. It’s overpowered, under-marketed, and criminally underrated. If Zapier is automation comfort food, Make is the espresso shot — a little bitter, a little intense, but exactly what you need to wake up your workflows.

Use it when you:

  • Want more control than Zapier offers.
  • Need to inspect and transform data mid-pipeline.
  • Enjoy building systems that feel alive.

Avoid it when you:

  • Just want simple, fire-and-forget automations.
  • Have teammates who panic at the sight of JSON.

Final Word

Make doesn’t just connect apps — it lets you choreograph data. It’s not perfect, but it’s fun, powerful, and built for people who don’t want to hide from complexity. If automation tools were instruments, Zapier’s a ukulele. Make? A full-blown modular synth — capable of brilliance and noise in equal measure.

Integromat

From Integromat to Make: The Glow-Up Nobody Saw Coming

If you’d rather skip the enlightening anecdote about integromat becoming make.com, you can find our Make review here. If you love a good coding origin story as much as we do, well then read on:

Once upon a time, Integromat was the weird little Czech automation tool only power users knew about — a hidden gem buried under Zapier’s marketing empire. It looked like a hacker’s playground: blue bubbles, spaghetti lines, and a user interface that screamed “built by engineers, for engineers.” And honestly, that was part of its charm.

Then in 2022, the company dropped the bombshell: Integromat was becoming Make. Cue collective confusion, cautious optimism, and a few panicked Reddit threads from people wondering if their meticulously crafted scenarios were about to vanish into corporate rebranding hell.

integromat

The shift wasn’t just cosmetic. Make wasn’t trying to be “Zapier but cheaper” anymore — it was aiming to be a next-gen visual automation platform. The new interface was sleeker, more drag-and-drop, less 2010s spreadsheet energy. The pricing and backend got a refresh, too, and the company leaned hard into the idea of “building workflows like a developer, without writing code.”

Under the hood, though, the DNA stayed the same. The Make you use today is still Integromat at heart — the same looping, filtering, JSON-parsing powerhouse — just with better UX, cloud-scale ambitions, and a bit more swagger.

In short: Integromat grew up, hit the gym, and came back calling itself Make. It traded its “underground automation cult” vibes for “respectable SaaS startup with funding and a color palette.” But if you peel back the glossy purple UI, you’ll still find the same wild flexibility that made the original a secret weapon for automation nerds everywhere.

Integromat Timeline

2012 – The Birth of Integromat
A small team of Czech engineers launches Integromat, a tool that looks like a flowchart generator but secretly does API magic. Early users fall in love with its transparency — the ability to literally see your data flow through blue bubbles. Nobody outside of dev Twitter knows it exists yet.

2016 – The Power-User Underground
Integromat quietly builds a cult following among automation geeks, indie hackers, and overworked sysadmins who are tired of Zapier’s “five steps max” nonsense. It’s rough around the edges, but it’s also absurdly capable. You can loop, branch, parse, and call webhooks like a mini integration engine.

2019 – The SaaS Boom Hits
Suddenly, the world is drowning in SaaS tools. Everyone needs something to make them talk to each other. Integromat becomes the go-to for people who outgrew Zapier but aren’t ready for Airflow. Still, the branding feels… European. The name sounds like a Soviet appliance.

2020 – Integromat Gets Noticed
Investors finally realize this scrappy automation tool might actually be onto something. The team starts hiring, polishing, and preparing for a global relaunch. The platform is rock solid, but the name? Still a mouthful. (“Is it Integrate-o-mat? In-teg-row-mat? Insta-gromat?” Nobody’s sure.)

2022 – The Rebrand: Integromat → Make
Boom. Integromat drops the blue bubbles, the old UI, and its tongue-twister name — reborn as Make. The new platform looks modern, modular, and unmistakably cool. The logo gets minimalist. The color scheme goes full neon. Long-time users grumble (“RIP my favorite nerd tool”), but new users flock in.

2023 – Growing Pains and Glory
The transition isn’t perfect — legacy users face migration headaches, and some features lag behind. But the community grows fast. Make starts positioning itself not just as an automation platform, but a visual development environment — a middle ground between no-code and traditional programming.

2024 – Make Finds Its Groove
The rebrand pays off. Make gains traction with teams who want Zapier-level ease plus developer-grade power. Its community forums hum with both marketers and data engineers — a rare crossover. It becomes the quiet workhorse behind thousands of startups and indie automations.

Translation: Integromat didn’t die. It just got a UI facelift, a new swagger, and a shorter name. Same soul, fewer vowels

The Same Brain, New Hoodie

Let’s cut through the marketing fluff: Make is still Integromat — just dressed better and speaking fluent startup. Underneath the glow-up, the logic engine, the module system, and that signature visual data pipeline are all intact. The difference is in the vibe and the vision.

From a technical standpoint, the rebrand brought real upgrades. The UI finally feels modern (you can actually find things now), the performance got a boost, and integrations are rolling out faster. The dev team’s clearly been investing in infrastructure — latency is down, error handling is sharper, and webhooks no longer feel like they’re riding public transit.

The new branding also signals a cultural pivot: Make wants to be a platform, not a product. It’s positioning itself between the low-code “click-and-hope” crowd (Zapier, IFTTT) and the orchestration big leagues (Airflow, Prefect, Dagster). That’s a bold move — and it’s working. Engineers who once wrote it off as “just for marketers” are now using it to prototype pipelines, manage micro-automations, and even glue together internal tools.

The biggest win? Make embraces complexity without hiding it. It trusts users to handle branching logic, loops, and transformations — the stuff Zapier pretends doesn’t exist. And that’s why devs are starting to respect it.

Still, let’s be honest: Make isn’t perfect. The migration from Integromat broke some workflows, the learning curve is steeper than advertised, and debugging large scenarios can feel like spelunking through a rainbow spaghetti monster. But for those who crave control without coding everything from scratch, Make hits the sweet spot.

Integromat didn’t “grow up” so much as it leveled up. It went from niche European hacker tool to a polished, global automation platform that still lets you peek under the hood.

So yeah — it’s the same brilliant chaos you loved, just with fewer umlauts and a better wardrobe.

Fivetran Review

There’s a moment in every data engineer’s life when they realize they’ve become a glorified cron-job babysitter. One pipeline’s down, another’s spewing duplicates, and that “temporary” Python script from 2019 is now business-critical. Then someone whispers the magic word: Fivetran.

It promises a simple gospel — never build ingestion again. You point it at your data sources, pick your destination warehouse, click a few buttons, and boom — pipelines appear like it’s data Christmas. No scripts, no Airflow DAGs, no Kafka headaches. It’s the SaaS fairy tale of data engineering. And you know what? It actually delivers.

fivetran review

What Fivetran Can Do For You

Fivetran is the Plug-and-Play Ingestion Dream (and the Control Freak’s Nightmare)

At its core, Fivetran is data ingestion as a service — a fully managed ELT platform that automates the boring part: extracting data from APIs, databases, and SaaS tools, and loading it into your warehouse.

It handles the connectors, the schema mapping, the incremental sync logic, the error retries — everything you’d normally duct-tape together with scripts and coffee. It’s the invisible plumbing that makes your analytics stack hum quietly in the background. The tagline could be: “We built the pipelines so you don’t have to.” And if you’ve ever tried maintaining 30 different API connectors manually, you know what a blessing that is.

What Fivetran Connects To

  • Databases: MySQL, PostgreSQL, SQL Server, Oracle
  • SaaS apps: Salesforce, HubSpot, Shopify, NetSuite, Zendesk, Google Ads
  • Cloud storage: S3, GCS, Azure Blob
  • Destinations: Snowflake, BigQuery, Redshift, Databricks, and more

Basically, if it holds data and someone’s willing to pay for it, Fivetran has a connector.

ELT, Not ETL — And Why That Matters

Fivetran was an early cheerleader for the ELT revolution — extract and load everything raw, then transform it in the warehouse. This flipped the script on how data pipelines worked. Instead of pre-processing data in transit (the old ETL model), Fivetran just gets it in fast and clean, leaving the transformation to tools like dbt downstream.

It’s a deceptively simple idea, but it changed everything. No more monolithic transformation servers. No more hand-written parsing logic. Just raw data, sitting in your warehouse, ready for modeling. Fivetran was among the first to say: the warehouse is your engine — use it.

Fivetran + dbt = Power Couple

Fivetran handles extraction and loading.
dbt handles transformation and modeling.

Together, they’re like peanut butter and version control. You can chain them in orchestration tools like Prefect or Airflow, or just schedule dbt jobs directly after Fivetran runs. That’s the modern data stack in miniature — modular, clean, and allergic to custom scripts. In fact, Fivetran and dbt are such a cute couple, they just announced they’re merging.

Why Engineers Love (and Fear) Fivetran

Let’s give credit where it’s due — Fivetran nails reliability. The syncs are resilient, the monitoring is solid, and the dashboards are clear enough that even your PM can read them. Schema changes? Fivetran detects and updates automatically. APIs go down? It retries. The connectors are constantly updated, and there’s real engineering rigor behind them.

It’s the kind of tool you install once and then forget exists — which is basically the highest compliment a data engineer can give. But there’s a flip side: you don’t control much.

Fivetran is fully managed — emphasis on managed. You can’t tweak connector logic, edit queries, or customize transformation before load. You live by their schema mapping rules and their sync intervals. For control freaks (read: most engineers), that can feel like living in someone else’s apartment. You can decorate a bit, but don’t touch the walls.

Fivetran Pricing (Reality Check)

Let’s talk money — because Fivetran definitely will.

Fivetran charges based on monthly active rows (MAR) — the number of rows that change in a given month. It’s clever, usage-based pricing that scales with activity, not with data volume.

The good: small teams can start cheap.
The bad: once your business scales, so does your bill — aggressively.

Plenty of startups have had their CFOs experience heart palpitations after checking the Fivetran invoice post-Black Friday. You’re paying for peace of mind, not thrift.

Watch Your Sync Frequency

Don’t sync every connector every five minutes just because you can.
Set sensible intervals, monitor MAR, and keep an eye on cost dashboards.

Fivetran makes it easy to forget you’re spending money — until you remember you’re spending money.

The Real-World Verdict

So, where does Fivetran actually shine?

  • Fast setup: You can go from signup to production pipeline in under an hour.
  • Reliability: Set-and-forget ingestion that rarely breaks.
  • Maintenance: Practically zero. No cron jobs, no version drift, no panic Slack messages at 3 a.m.

Where it fails:

  • Customization: Minimal flexibility for complex data extraction.
  • Cost: Not for the faint-of-budget.
  • Debugging: You rely heavily on Fivetran’s logs and support team.

In other words, it’s a trade-off — control vs. convenience.

If you’re building a finely tuned, bespoke data system, you’ll probably hate the lack of low-level access.
If you just want your pipelines to work, you’ll love how boring Fivetran makes ingestion. And honestly, boring is beautiful when your on-call rotation starts at midnight.

Final Thoughts

Fivetran did for data ingestion what Kubernetes did for deployment: it abstracted the pain away. It’s not flashy, not hackable, and not cheap — but it works, reliably and predictably, which in data engineering is about as rare as a passing unit test on the first try.

You can build connectors yourself, or you can accept that your time is better spent on modeling, analytics, and building actual value. Fivetran is the tool for people who want to stop reinventing ingestion and start delivering data. You’ll lose some control, gain a ton of sanity, and maybe — just maybe — get your weekends back.

n8n Review

n8n (pronounced “n-eight-n”) is what happens when automation meets simplicity and autonomy. It’s a workflow automation platform that sits somewhere between no-code convenience and developer-grade flexibility—a kind of self-hostable Zapier for people who want to peek under the hood. For developers and data engineers tired of closed ecosystems and API limitations, n8n offers an appealing alternative: visual automation you can fully own, extend, and deploy on your own terms.

n8n

At its core, n8n is built around nodes—modular building blocks that represent actions, triggers, or data transformations. Each workflow starts with a trigger (like a webhook, cron schedule, or event), and flows through a series of nodes that connect APIs, process data, or execute logic. The visual editor makes this intuitive: you drag, drop, and connect nodes into directed graphs that define your automation logic. But unlike most low-code tools, you can also inject custom JavaScript directly into any step, giving you granular control over how data moves and mutates.

What makes n8n stand out is its balance between accessibility and power. You don’t need to be a full-time developer to use it, but if you are one, you won’t feel boxed in. Every node’s input and output can be scripted, every workflow can use variables, loops, or conditional logic, and you can build and publish your own custom nodes in TypeScript. The platform also supports webhooks, database queries, and external API calls out of the box—so it scales from quick office automations to fairly complex data flows.

One of n8n’s biggest selling points is that it’s self-hostable. That means no opaque pricing tiers, no limits on workflow runs, and no sensitive data leaving your network if you don’t want it to. You can deploy it with Docker, integrate it into your CI/CD pipeline, or even build custom extensions for internal systems. This openness has made n8n a favorite among privacy-conscious organizations and developers who want automation without vendor lock-in.

Still, that freedom comes with tradeoffs. Self-hosting means you manage the infrastructure—the database, scaling, backups, and updates. n8n offers a hosted “Cloud” version for convenience, but part of its appeal is independence, so many users prefer to run it locally or on private servers. For small teams without DevOps bandwidth, that can be a hurdle. Performance is generally solid, but large, data-heavy workflows may need tuning to avoid memory bottlenecks.

From a usability standpoint, n8n’s interface is cleaner than Apache Airflow or Node-RED, but not as polished as commercial SaaS tools like Zapier or Make. It’s getting better fast, though—the community is active, releasing new nodes, integrations, and templates almost weekly. The documentation is straightforward, and because it’s open-source, you can actually read the code when something breaks.

In short, n8n is ideal for developers who value flexibility, transparency, and ownership. It’s not just a toy for light integrations—it’s a programmable automation layer you can adapt to your stack. If you like the idea of building custom workflows with visual clarity but developer-level control, n8n hits the sweet spot between Zapier’s ease and Airflow’s power. It’s automation on your terms, with code when you want it and simplicity when you don’t.

Who Should Use n8n

n8n is perfect for developers and technical teams who want automation without surrendering control. If you’ve outgrown Zapier’s simplicity but don’t want to dive into the full DevOps complexity of Airflow, n8n offers a middle ground: visual workflows powered by real code. It’s ideal for small to mid-sized engineering teams, data specialists, and SaaS integrators who need to connect systems quickly while maintaining ownership of infrastructure and logic.

Because it’s self-hostable, n8n fits well in environments with strict data privacy or compliance requirements, such as healthcare, finance, or government. You can deploy it on-premises, behind your firewall, and integrate it directly with internal APIs and databases. That makes it particularly valuable for organizations that can’t—or won’t—rely on third-party cloud connectors.

n8n also shines in prototyping and internal automation. Developers can spin up quick integrations (like syncing a Postgres database to Slack alerts, or enriching CRM data from an API) in minutes, using visual logic instead of scaffolding full microservices. The built-in scripting node lets you write JavaScript inline, so you can apply transformations, filters, or conditional routing directly inside your workflows.

Finally, if you’re a startup or small team with evolving needs, n8n scales with you. You can start small on a single Docker instance and expand into multi-node clusters later. Its active open-source community means new integrations and features appear rapidly, and you’re never locked out of the underlying logic. For devs who like to own their tools and tune their stack, n8n hits the sweet spot between agility and autonomy.

When Not to Use n8n

n8n isn’t the best choice if you want zero maintenance or turnkey SaaS simplicity. While setup is straightforward, self-hosting still means handling updates, scaling, and backups. If you’re an operations-light business or non-technical team, managed tools like Zapier or Make will deliver faster results with less friction.

It’s also not designed for heavy, production-scale data pipelines—for those, tools like Prefect or Airflow are better suited. n8n excels at flexible, mid-tier automation, but it’s not a distributed orchestrator for petabyte-scale workloads.

N8N FAQs

What is n8n?

n8n is a tool that helps you automate repetitive tasks by connecting different apps and services. It’s like having a digital assistant that moves data, updates systems, or triggers actions automatically—without you doing it manually.

Is n8n free?

Yes, n8n’s Community Edition is free to self-host. You can run unlimited workflows, use all integrations, and add unlimited users—but you’ll need your own server or cloud instance. n8n also offers a free cloud trial, letting you explore the platform without setup, and paid plans with extra features for teams and businesses.

Is n8n open-source?

No, Their licensing does not meet the common open source definition.

Is n8n better than Zapier?

It depends on your needs. n8n is self-hostable, so you fully control your workflows and data. It allows custom scripting and building complex integrations, which gives developers more flexibility than Zapier. Zapier is simpler and easier for non-technical users, but n8n is stronger for advanced automation, privacy-focused setups, and workflows that grow with your business.

Who should use n8n?

It’s ideal for people or teams who want to save time and reduce repetitive tasks, especially if they use multiple apps daily. It works for small businesses, freelancers, or anyone who wants more control over automation.