

Estimated reading time: 5 minutes
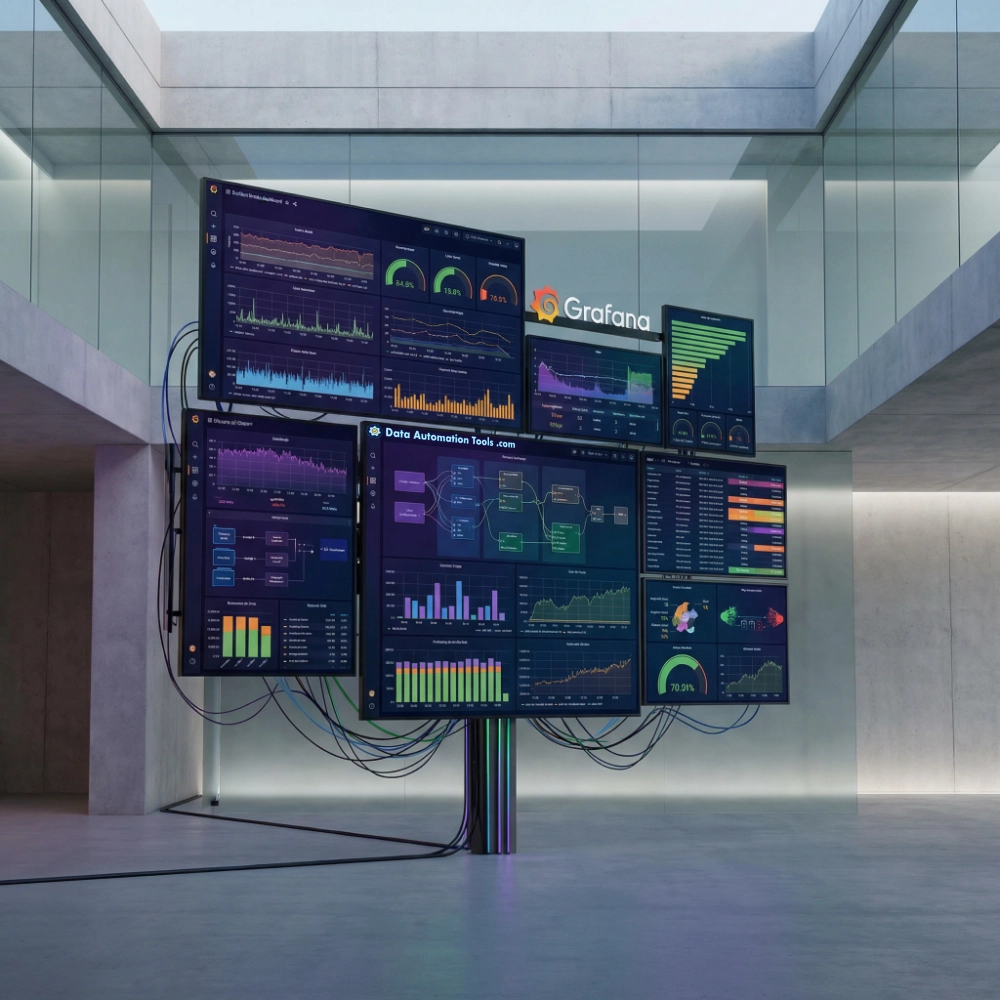
Grafana is an open-source observability and visualization platform designed to make operational data intelligible to humans. It does not collect metrics, logs, or traces itself, and it does not function as a database or storage engine. Instead, Grafana reads from systems that already store telemetry and renders that data into dashboards, panels, and alerts that engineers can use to understand system behavior. Its role is interpretive rather than generative: Grafana exists to translate high-volume, high-frequency signals into views that support diagnosis, trend recognition, and operational response.
This positioning matters. Grafana is not an analytics engine in the sense of transforming or modeling data, and it is not an automation engine that executes remediation actions. It sits at the boundary between systems and people, acting as the interface through which infrastructure and application state becomes visible. In modern environments where systems are distributed, ephemeral, and noisy, that boundary is where understanding either emerges—or fails.
Origins and Architectural Posture
Grafana originated as a data visualization tool for time-series data and evolved into a general observability interface by deliberately refusing to own storage. From the beginning, its architecture emphasized extensibility through plugins rather than vertical integration. Data sources are queried in place, visualizations are layered on top, and dashboards are assembled to reflect the mental models of the teams using them.
That architectural choice explains Grafana’s durability. Because it does not impose a single telemetry backend, it adapts to environments where metrics may live in one system, logs in another, and traces in a third. Grafana’s internal model assumes heterogeneity as the norm, not the exception. The platform’s job is not to unify storage, but to unify interpretation.
How Grafana Is Used in Real Systems
In practice, Grafana is most often deployed as the primary interface for monitoring production systems. Infrastructure teams use it to observe host health, resource utilization, and service availability. Application teams rely on it to track latency, throughput, and error rates. Site reliability engineers use it to monitor service-level indicators and to correlate symptoms across layers of the stack.
As systems mature, Grafana frequently becomes the place where different kinds of telemetry converge. Metrics show that something changed, logs explain what happened, and traces reveal where time was spent. Grafana does not create these relationships automatically, but it provides a single workspace where humans can follow them. This is why Grafana is often described as the “front end” of observability stacks: it is where investigation happens, even though the data lives elsewhere.
Many organizations now consume Grafana through managed offerings, particularly Grafana Cloud, which bundles the same interface with hosted telemetry backends. This reduces operational overhead but introduces a new dependency: the observability platform itself becomes critical infrastructure. Grafana Labs publishes public incident reports and post-incident analyses for outages affecting its managed services, reflecting an industry norm that observability providers must themselves be transparent about reliability.
The Surrounding Ecosystem
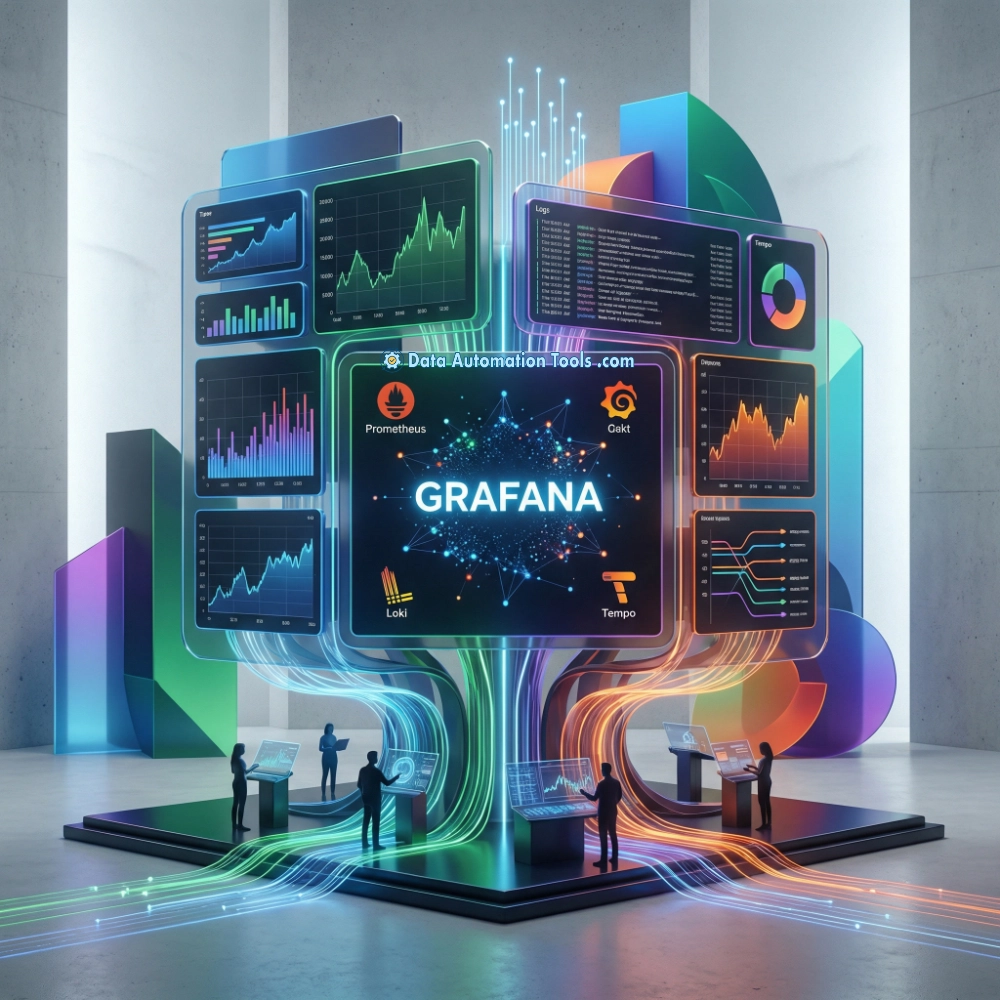
Grafana’s usefulness is inseparable from the ecosystem it sits within. It commonly connects to time-series databases used for metrics, log aggregation systems that index application output, and tracing backends that record distributed request flows. It also integrates with traditional databases and cloud provider monitoring services, which allows teams to mix operational telemetry with domain-specific data.
Because Grafana does not dictate how data is produced or stored, it often becomes the most stable layer in a changing stack. Teams may replace a metrics backend, migrate log storage, or adopt new tracing systems, while Grafana remains the constant interface engineers use every day. This stability is one reason Grafana often outlives individual infrastructure decisions.
What Grafana Makes Possible
Grafana’s most important contribution to analytics and visualization is shared situational awareness. Dashboards act as social artifacts: they encode what a team believes matters, how health is defined, and which signals deserve attention. When well designed, they allow multiple roles—developers, operators, managers—to reason from the same evidence without needing the same technical depth.
Grafana’s composability also enables correlation that would otherwise be manual. Engineers can place related signals side by side, align them in time, and observe relationships that are difficult to infer from raw data alone. This does not eliminate the need for expertise, but it shortens the distance between observation and understanding.
Recent versions of Grafana and its managed services reference machine-assisted features for correlation and insight. Treated conservatively, these features aim to help users navigate large volumes of telemetry rather than replace human diagnosis. There is no evidence that Grafana deploys autonomous decision-making systems that act on infrastructure without human control; its role remains advisory and observational.
Risks and Failure Modes
Grafana’s risks stem from its centrality. A dashboard can only reflect what is instrumented, and gaps in telemetry often masquerade as system health. Teams sometimes mistake clean dashboards for complete visibility, only to discover during incidents that critical signals were never captured. Grafana does not cause this problem, but it can conceal it.
Alerting introduces another risk: when alerts are poorly scoped or overly sensitive, engineers experience fatigue and begin to ignore signals. Grafana provides alerting mechanisms, but it cannot enforce judgment about what deserves an interruption. That responsibility remains organizational.
Security is also a real concern. Grafana instances often have access to sensitive operational data, and misconfiguration has led to documented vulnerabilities, including a high-profile directory traversal flaw disclosed and patched in 2021. This incident is frequently cited as a reminder that observability tooling must be secured with the same rigor as production systems.
Finally, when Grafana itself is unavailable—whether due to misconfiguration, infrastructure failure, or managed service outage—teams temporarily lose visibility. This amplifies the impact of otherwise routine incidents and reinforces the need to treat observability platforms as first-class infrastructure.
Grafana’s Actual Role
Grafana is best understood as a lens, not a brain. It does not decide, predict, or automate outcomes. It reveals. Its value lies in making complex systems legible under pressure and in giving teams a shared frame of reference when something goes wrong. Used carefully, it strengthens operational discipline. Used uncritically, it can project confidence where understanding is incomplete.
That duality is not a flaw; it is the nature of observability itself.